How to track event attendee app downloads using business QR codes? Tracking event app downloads involves deploying highly visible business QR codes embedded with location and session tokens to segregate offline scans from other concurrent web channels.
A QR code for business in field marketing is a parameterized matrix barcode engineered to route offline event attendees to platform-specific app stores while passing dynamic channel identifiers to attribution systems. By assigning distinct channel codes to physical booths, keynote displays, and printed collateral, enterprise growth teams measure scan-to-install conversions and audit conference campaign Return on Investment (ROI) in real time.
| Term | Definition | Related Entity | Search Intent Role |
|---|---|---|---|
| QR Code for Business | A configurable barcode assigned to specific offline physical placements for channel attribution. | Mobile Measurement Partner | Informational / Commercial |
| QR Code Tracking | The programmatic capture of scan metrics, device context, and post-install conversions where supported and verifiable. | Channel Code (channelCode) |
Technical / Informational |
| Create QR Code for App | The process of encoding dynamic redirection URLs containing attribution keys into visual barcodes. | App Parameter Installation | Commercial / Practical |
Why Is a QR Code for Business Essential for Conference Attribution
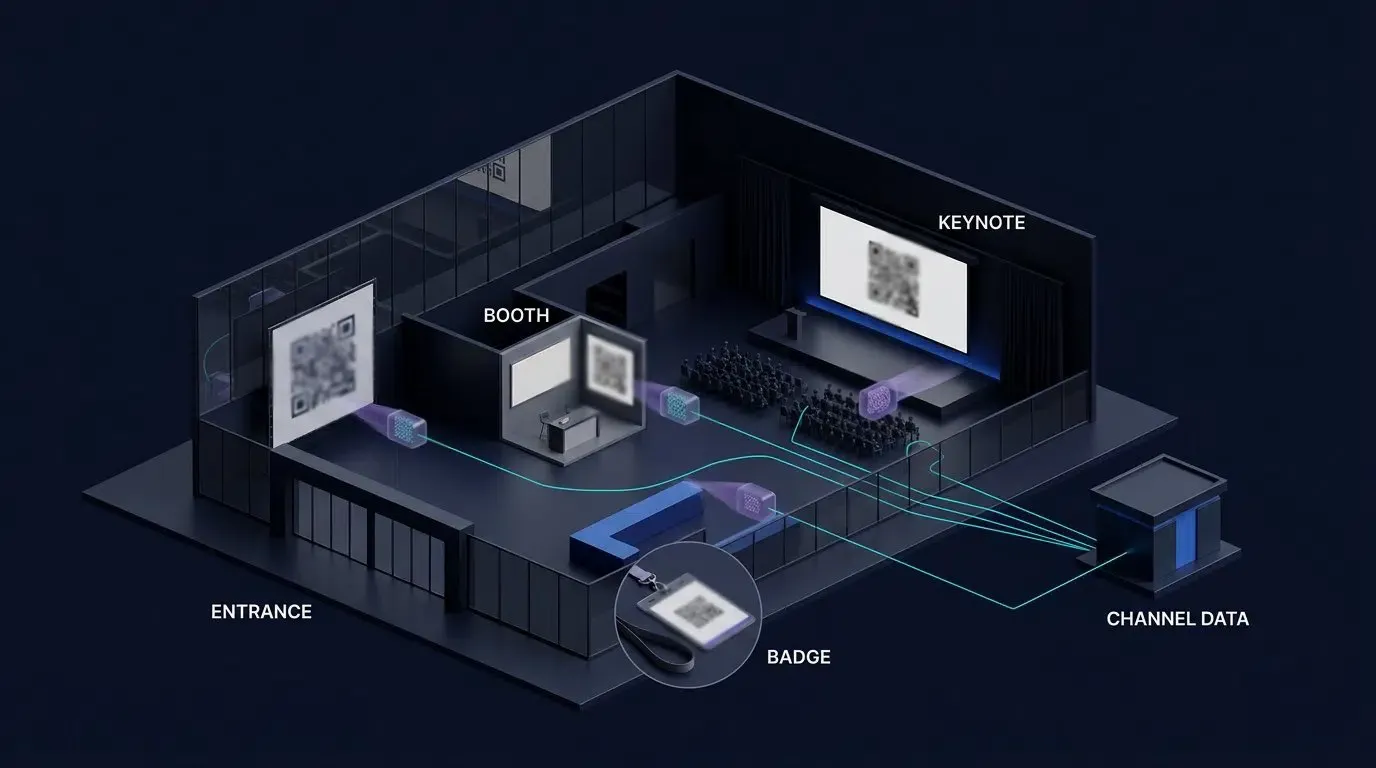
The Offline Black Hole: Why Traditional Print Media Lacks Measurable Conversion Metrics
Enterprise field marketing and event sponsorships represent substantial budget allocations, often encompassing booth rentals, floor buildouts, branded merchandise, and multi-speaker presentations. Despite these investments, offline conference marketing frequently operates in an attribution void. When organizations print generic marketing URLs across booth backdrops, pull-up banners, flyers, and employee badges, all resulting digital engagements appear in web and mobile analytics as unclassified direct traffic or organic search volume.
Without designated tracking tokens, growth teams cannot determine whether an influx of new mobile application registrations originated from a high-profile keynote session, a prime exhibition booth, or an external digital marketing campaign running concurrently. This lack of visibility distorts cost-per-acquisition (CAC) accounting and prevents data-driven decisions regarding which annual industry expos deliver positive revenue yield versus which events drain field marketing resources.
Eliminating Survey Noise: Replacing Manual How Did You Hear About Us Forms with Automated Scanning
To bridge the offline attribution divide, organizations historically relied on post-registration user surveys, asking new users to select how they discovered the application via dropdown menus or text fields. While simple to deploy, manual self-reporting introduces substantial operational error:
- Severe Recall Bias: Event attendees frequently forget the exact booth number, flyer variant, or partner presentation that prompted their initial interest, categorizing their discovery generically as general word-of-mouth or an unspecific event mention.
- Onboarding Friction and Churn: Adding mandatory survey fields to the initial onboarding workflow introduces friction, increasing registration abandonment rates during fast-paced exhibition environments.
- Imprecise Categorization: Survey dropdowns cannot scale to measure micro-touchpoints, such as differentiating scans from a badge lanyard versus a table tent flyer at an exhibitor cocktail lounge.
Parameterized business QR codes can reduce dependence on attendee self-reporting by recording the physical placement associated with an eligible scan session. Post-install source recovery remains conditional on the deployed platform and attribution mechanism. Where reliable matching is unavailable, preserve the installation or first-launch event as unattributed rather than claiming a precise booth source.
Isolating Event Traffic from Concurrent Digital Paid Search and Social Campaigns
Major industry conventions do not occur in digital isolation. When an enterprise sponsors an expo, brand visibility surges across social networks, press releases, and targeted digital advertisements. If field teams deploy un-parameterized links or generic app store shortcuts, digital attribution models inadvertently credit search ads or social campaigns for downloads actually stimulated by on-site physical conversations.
Unique, server-validated channelCode values allow teams to segment observed event scan sessions separately from other campaign traffic. When a supported attribution mechanism links a downstream event to an eligible conference session, the reporting system can assign a booth or placement source. Unmatched and overlapping journeys must remain visible in the reconciliation report.
How Do Parameterized Links Isolate Offline Event Scans from Digital Traffic
The Architecture of Offline Query Keys: Assigning Unique Channel Identifiers
The foundation of offline event tracking lies in structuring destination URLs to convey campaign taxonomy. Rather than directing attendees directly to a public app store listing, the visual matrix encodes a secured intermediate redirection URL hosted on an attribution gateway:
https://app.example.com/event?channelCode=ces_2026_booth_a12&promo=conf_vip
In this architecture, the channelCode represents a durable identifier mapped directly to a specific physical asset. When the barcode is processed by a camera scanner, the query string transmits metadata defining:
- The Parent Campaign: The umbrella event identifier.
- The Specific Placement: The precise physical location, such as a booth number, entrance hall, or presentation slide.
- The Collateral Format: The medium carrying the matrix, such as a badge lanyard, table tent, or printed handout.
- Custom Contextual Parameters: Promotional incentives, such as demo credits or access tokens.
By structuring query keys hierarchically, field managers can inspect overall event performance while retaining the ability to evaluate the conversion velocity of individual booth staff or marketing collateral formats.
Distinguishing Multi-Booth Collateral: Main Entrance vs. Booth Banners vs. Lanyard Badges
Large-scale industry conferences involve multiple physical distribution points, each characterized by distinct attendee mindsets and interaction dynamics. Effective campaign design requires deploying discrete tracking variants across these locations:
- High-Traffic Broad Signage (Main Entrance and Registration Halls): Characterized by rapid foot traffic and brief viewing windows. QR codes placed on registration banners measure macro-awareness and early attendee arrival trends.
- Interactive Exhibition Booths (Demo Stations and Backdrops): Scanned during in-depth sales conversations. Installs originating from demo booth QR codes correlate with higher middle-funnel intent, longer session durations, and qualified lead status.
- Handheld and Wearable Collateral (Badges, Lanyards, and Handouts): Carried by attendees throughout the event. Scans from printed collateral often occur hours or days after the physical interaction, allowing growth teams to measure delayed post-event activation.
Segregating these physical placements using dedicated sub-channels enables marketing leadership to evaluate the relative efficiency of each asset type.
Platform-Aware Store Routing and Deferred Attribution Boundaries
A single business QR code can contain an HTTPS destination that handles both iOS and Android visitors. The landing page may use available platform hints to offer the appropriate app store destination, but User-Agent detection is not authoritative. Provide visible App Store and Google Play choices when platform detection is ambiguous or the user prefers another device.
For attendees who already have the app installed, verified Apple Universal Links or Android App Links may open supported in-app destinations. For attendees without the app, the landing page can direct them to the relevant store. Neither a store redirect nor a web query parameter automatically guarantees that the native app will receive the original conference channel after installation.
On Android, Google Play Install Referrer can support the recovery of referral metadata for eligible Google Play installation flows. On iOS, use only a documented, permitted attribution or referral mechanism supported by the deployed integration. If the original conference channel cannot be recovered reliably, classify the installation as unattributed or unknown rather than assigning an invented booth source.
Managing High-Density Scan Spikes During Keynote Speeches and Product Demos
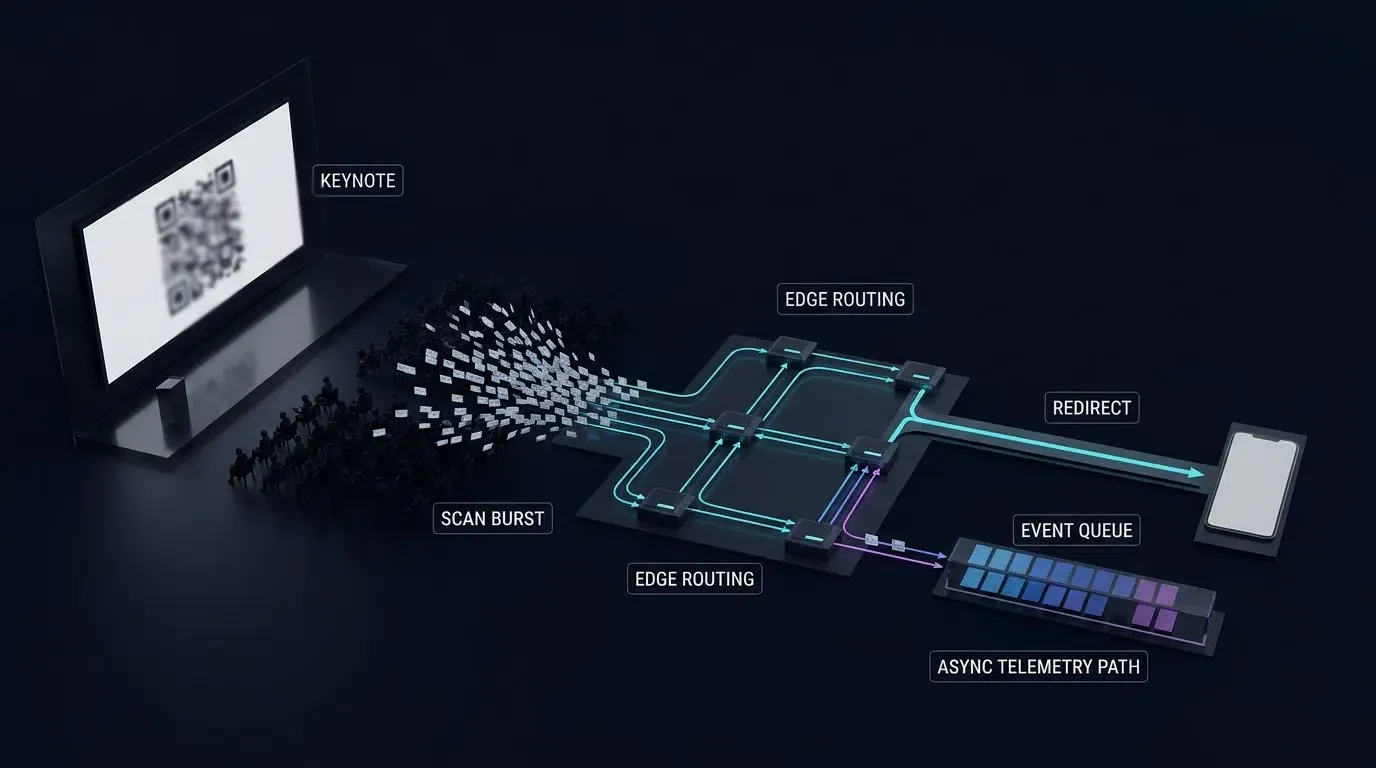
Conference presentations present unique traffic spikes. When an executive presents a product release on a mainstage auditorium and displays a download QR code across a presentation screen, large numbers of attendees may scan the visual matrix concurrently.
This sudden surge creates a localized distributed burst where multiple HTTP requests hit the redirection endpoint within a brief window. If the redirection infrastructure relies on un-cached application servers or complex relational database lookups, the gateway risks latency degradation or connection timeouts.
Teams deploying conference campaigns should establish edge redirection nodes backed by distributed key-value caches and validate their infrastructure using load testing to handle concurrent traffic spikes reliably.
Technical Workflow for Configuring Event Channel Codes
Defining Your Event Taxonomy in the Attribution System
Before printing physical marketing collateral, marketing and engineering teams must coordinate an unambiguous naming convention. A standardized taxonomy ensures clean data aggregation across internal business intelligence (BI) systems.
A standard convention follows a delimited token structure:
[EventIdentifier]_[PhysicalZone]_[AssetType]_[MaterialVariant]
Examples include:
mwctokyo_hall3_banner_rollupfintechsummit_stage_slide_keynoteretailtech_booth402_handout_flyer
Maintaining consistent casing and avoiding special characters prevents URL encoding errors when physical scanners parse the matrix strings.
Binding Custom Referral Parameters to Landing Page Redirection URLs
Attribution extends beyond counting raw installations; it also supports contextual onboarding where supported by the client SDK. When attendees install an application at a trade show, the onboarding flow can reflect their event context—such as pre-populating an event networking group or granting an exhibition coupon—if parameters are recovered successfully post-installation.
OpoInstall, a mobile attribution and deep linking platform, allows growth teams to pass contextual parameters through supported redirection workflows. When configuring the event landing page, custom parameters can be appended:
https://event.example.com/join?channelCode=expo_2026_b1&event_role=attendee
Upon first launch, if the client SDK retrieves these parameters through a supported attribution mechanism, the application can tailor the initial experience accordingly. If parameter recovery is unavailable, the application should fall back smoothly to a standard onboarding path.
Developers preparing mobile application codebases for conference deployments can obtain the native libraries through attribution SDK integration resources.
Generating Visual Collateral: High-Contrast Layouts for Difficult Lighting Environments
Physical exhibition centers present challenging optical environments, characterized by variable spotlights, dim breakout rooms, or reflective laminate banners. If a QR code is poorly rendered or lacks adequate contrast, mobile camera sensors fail to focus.
To support reliable scanning, graphic designers and production teams should follow practical layout guidelines:
- Error Correction Level (ECC): Generate barcodes using Level M (15%) or Level Q (25%) error correction. High ECC allows cameras to decode the matrix even if the physical surface is slightly creased, scuffed, or partially shadowed. However, ECC ratings indicate mathematical recovery capacity, not a guarantee that a visual logo covering 25% of the barcode will scan reliably across all camera sensors.
- Adequate Quiet Zone: Maintain an unprinted quiet zone border around the perimeter of the barcode equal to at least four times the width of a single data module.
- High Color Contrast: Maintain strict dark-on-light contrast. Avoid light grey modules on white backgrounds, and avoid inverted white modules printed on dark surfaces unless tested across diverse camera sensors.
- Physical Sizing Considerations: As an empirical rule of thumb, sizing can begin around one-tenth of the anticipated viewing distance:
This ratio serves as an approximate starting point. Actual scanning performance depends heavily on barcode module density, ambient lighting, camera hardware, and surface reflectivity, and must be validated with physical print proofs prior to mass production.
[Attendee Scans Business QR Code]
              │
              ▼
[Application-Owned / Verified Gateway]
              │
    ┌─────────┴─────────┐
    ▼                   ▼
[iOS App Store]    [Google Play Store]
    │                   │
    └─────────┬─────────┘
              ▼
[First App Launch (SDK Initialization)]
              │
              ▼
[Attribution Reconciliation (Where Supported)]
Data Pipeline for Ingestion of High Volume Conference Scans
Handling Concurrent Scanning Traffic at Edge Redirection Nodes
When an attendee scans a physical matrix, the camera app invokes the device’s default web browser to execute an HTTP request against the attribution endpoint. The ingestion gateway processes incoming requests through several discrete steps:
- Extract Client Context: Parse basic request metadata, including the incoming User-Agent header and language preferences.
- Validate Channel Integrity: Match the incoming
channelCodeagainst registered event campaigns. - Emit Telemetry Event: Transmit an asynchronous scan event to ingestion queues for real-time reporting.
- Execute Redirection: Issue an immediate HTTP redirect to the destination app store or landing page.
Decoupling data logging from the user-facing HTTP redirection can help reduce redirect latency, subject to load testing.
Preserving Event Context Without Device Fingerprinting
The routing gateway may create a short-lived, random scan-session identifier for server-side event logging and deduplication. That identifier tracks a web interaction within its permitted scope; it must not be presented as an automatic identity bridge from an anonymous browser session to a newly installed mobile app.
Do not generate a device fingerprint from browser configuration, network properties, language, location, or related device traits to match a pre-install web session to an app installation. Hashing those signals does not remove the underlying re-identification concern.
Do not silently write attribution tokens to the system clipboard or assume that the native application can retrieve clipboard contents after installation. Clipboard-based handoffs introduce user-experience, privacy, and platform-reliability constraints and should not be described as a default deferred attribution method.
Maintain separate reporting fields for:
- QR Landing-Page Requests and Eligible Scan Sessions: Observed web traffic at the gateway.
- Outbound Store Redirects: Successful handoffs to app marketplaces.
- Observed Native App First Launches: Initial application opening events recorded by the SDK.
- Installs Attributed Through Supported Mechanisms: Installations matched via verified platform channels.
- Registrations and Downstream Conversions: Verified user milestone achievements.
Where event identity cannot be reconciled across these stages, report the unmatched counts explicitly. This preserves a credible funnel without fabricating attribution continuity.
Detailed technical specifications covering Web SDK parameters and edge redirection workflows can be reviewed in the OpoInstall docs.
This illustrative application-owned schema records an observed QR routing event. It does not prove that a person scanned the code or that an app installation occurred. Device platform and network classifications may be incomplete or inferred, and post-install attribution requires a separately supported, privacy-compliant reconciliation mechanism.
Event Scan Analytics Payload Schema and Example
This JSON Schema defines an illustrative application-owned event scan telemetry format (EventScanAnalyticsPayload), capturing client context and channel parameters upon edge QR code scanning. Note that in JSON Schema Draft 2020-12, format validation (such as date-time) depends on the validator’s configuration. Network classifications are optional and inferred only when trusted network metadata is available.
{
  "$schema": "https://json-schema.org/draft/2020-12/schema",
  "title": "EventScanAnalyticsPayload",
  "type": "object",
  "additionalProperties": false,
  "required": [
    "scan_id",
    "scan_timestamp_utc",
    "app_id",
    "event_taxonomy",
    "client_context",
    "routing_decision"
  ],
  "properties": {
    "scan_id": {
      "type": "string",
      "minLength": 1,
      "maxLength": 128
    },
    "scan_timestamp_utc": {
      "type": "string",
      "format": "date-time"
    },
    "app_id": {
      "type": "string",
      "minLength": 1,
      "maxLength": 255
    },
    "event_taxonomy": {
      "type": "object",
      "additionalProperties": false,
      "required": ["channel_code", "campaign_name", "booth_identifier"],
      "properties": {
        "channel_code": {
          "type": "string",
          "maxLength": 64
        },
        "campaign_name": {
          "type": "string",
          "maxLength": 128
        },
        "booth_identifier": {
          "type": "string",
          "maxLength": 64
        },
        "collateral_type": {
          "type": "string",
          "enum": ["lanyard_badge", "backdrop_banner", "table_tent", "flyer_handout", "presentation_slide"]
        }
      }
    },
    "client_context": {
      "type": "object",
      "additionalProperties": false,
      "required": ["detected_os", "user_agent_raw"],
      "properties": {
        "detected_os": {
          "type": "string",
          "enum": ["iOS", "Android", "Desktop", "Unknown"]
        },
        "user_agent_raw": {
          "type": "string",
          "maxLength": 512
        },
        "network_type_inferred": {
          "type": "string",
          "enum": ["Cellular", "WiFi", "Unknown"]
        }
      }
    },
    "routing_decision": {
      "type": "object",
      "additionalProperties": false,
      "required": ["target_store", "redirect_http_status"],
      "properties": {
        "target_store": {
          "type": "string",
          "enum": ["Apple_App_Store", "Google_Play_Store", "Adaptive_Web_Fallback"]
        },
        "redirect_http_status": {
          "type": "integer",
          "enum": [301, 302, 307]
        }
      }
    }
  }
}
The example JSON payload below adheres to the EventScanAnalyticsPayload schema defined above:
{
  "scan_id": "scn_9876543210_event_tokyo",
  "scan_timestamp_utc": "2026-11-02T03:45:00Z",
  "app_id": "com.example.conferenceapp",
  "event_taxonomy": {
    "channel_code": "tokyo_tech_expo_booth_a12",
    "campaign_name": "Tokyo_Tech_Summit_2026",
    "booth_identifier": "Booth_A12_Enterprise",
    "collateral_type": "table_tent"
  },
  "client_context": {
    "detected_os": "iOS",
    "user_agent_raw": "Mozilla/5.0 (iPhone; CPU iPhone OS 18_0 like Mac OS X) AppleWebKit/605.1.15 (KHTML, like Gecko) Version/18.0 Mobile/15E148 Safari/604.1",
    "network_type_inferred": "Unknown"
  },
  "routing_decision": {
    "target_store": "Apple_App_Store",
    "redirect_http_status": 302
  }
}
How to Calculate Scan to Install Conversion Metrics and Event ROI
Structuring an Observable Conference Acquisition Funnel
A conference QR measurement system should distinguish raw web requests from verified downstream outcomes. A useful operational funnel contains five stages:
- Raw QR Requests: All requests received at the routing endpoint, including repeat visits, automated link previewers, and search engine crawlers.
- Eligible Scan Sessions: Requests grouped using a documented, privacy-conscious session definition. These represent estimated scan sessions, not unique physical devices.
- Store Redirect Events: Sessions in which the landing page initiates a supported app store handoff.
- Attributed First Launches: App first launches linked to an eligible campaign through a documented and permitted attribution mechanism.
- Qualified Conversions: Verified downstream actions such as completed registrations, demo bookings, or purchases.
Define the primary scan-to-attributed-first-launch rate as:
Also report the proportion of first launches for which channel information is missing or unavailable. Never count an unknown install as a confirmed booth-level conversion.
There is no reliable universal scan-to-install benchmark for every B2B conference. Results depend on event format, audience familiarity, application size, network quality, app-store behavior, and the attribution mechanism available on each platform. Compare events using consistent internal definitions, measured cohorts, and documented attribution windows.
Retention at Day 1, Day 7, and Day 30 can be measured for identifiable acquisition cohorts. Any claim that conference-acquired users retain better than paid digital users must be supported by actual cohort data, not assumed from the marketing channel alone.
Calculating Acquisition Costs, Event ROI, and Multi-Booth Cost Allocation
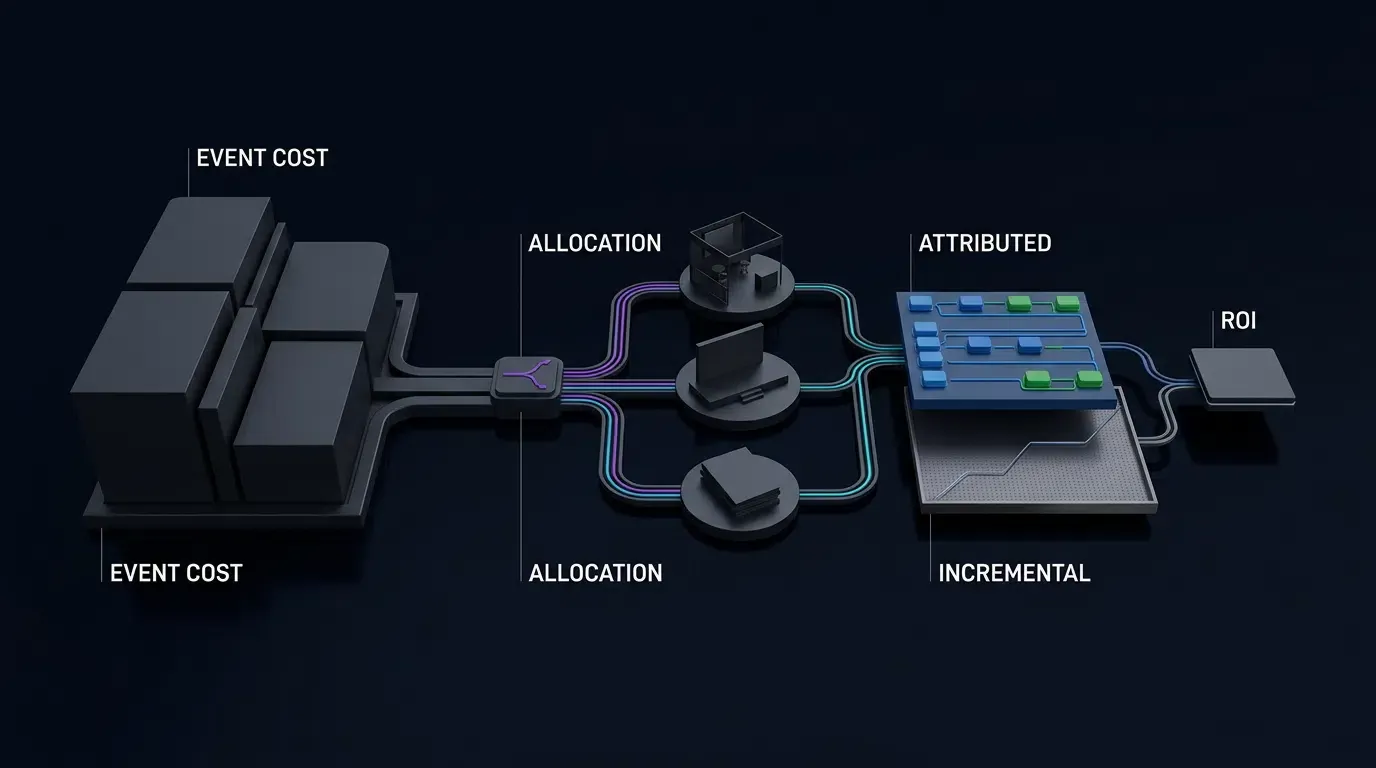
Cost per install, cost per attributed first launch, and event ROI answer different financial questions. They should not be used interchangeably.
Where a verified install count is available, calculate:
Where the reporting system observes attributed first launches rather than independently verified installations, use a separate metric:
For event financial return, calculate:
Incremental event contribution is the estimated additional financial contribution caused by the event, net of applicable variable costs. It is not equivalent to gross attributed revenue.
Illustrative Example: Suppose an event costs $18,000 and produces 180 attributed first launches. The observed cost per attributed first launch is $100. If a defensible incrementality analysis estimates $22,000 in incremental event contribution, the event ROI is approximately 22.2%. These figures are hypothetical, not industry benchmarks.
For multi-booth reporting, allocate shared event expenses using a documented and consistently applied method, such as floor-area usage, staffed hours, or direct sponsorship assignments. Report booth-specific costs separately where possible. A shared-cost allocation does not establish that a particular booth caused incremental conversions.
Dashboards should display eligible scan sessions, store redirects, attributed first launches, independently verified installations where available, qualified conversions, unmatched events, and acquisition costs using clearly named metrics. If causal incrementality cannot be estimated credibly, report attributed contribution and costs without labeling the result verified ROI.
For projected lifetime value, state the observation horizon, assumptions, and uncertainty separately from realized revenue.
Reconciling Direct Scans with Delayed Organic Installs
Not every conference attendee installs an application immediately upon scanning. Attendees may scan a poster during a session, become distracted, and complete the installation later over hotel Wi-Fi.
To account for this behavior, attribution platforms implement configurable lookback windows. If an installation occurs within the supported window and can be linked via an approved, privacy-compliant attribution mechanism, the event can be reconciled with the conference campaign. Where linking is not supported by platform rules, the conversion should remain classified as organic or unattributed.
Comparative Analysis of Offline Event Attribution Methods
Comparing Measurement Strategies Across Offline Marketing Operations
Enterprise growth teams select between various offline tracking strategies based on technical infrastructure, campaign objectives, and budget allocations. The table below provides a comparative evaluation of primary offline measurement methodologies:
| Attribution Method | Measurement Precision | Onboarding Friction | Implementation Overhead |
|---|---|---|---|
| Manual Survey Forms | Low (Subject to human recall bias) | High (Requires user typing) | Minimal (Form setup only) |
| Static Generic QR Code | Low (Counts raw web visits only) | Low | Minimal (Basic link generation) |
| Promo Code Cards | Moderate (Requires manual code input) | High (Significant drop-off risk) | Moderate (Physical print batches) |
| Parameterized Business QR Code | High (Booth-level attribution where supported and verifiable) | Minimal (Automated) | Low (Console configuration) |
Parameterized business QR codes can reduce manual promo-code entry and provide more granular event scan reporting. Verified booth-level installation attribution remains conditional on the supported platform mechanism, available event data, and the declared attribution policy.
Setting Up Multi Booth Channel Management in the Console
Creating H5 Channels and Sub-Channels in Bulk
Managing an enterprise presence at large exhibitions requires configuring multiple tracking links across sales representatives, exhibition zones, and collateral assets.
Where supported by the deployed attribution platform, hierarchical channel management allows teams to:
- Create Parent H5 Channel: Establish the primary event record.
- Generate Sub-Channels: Create nested sub-channels corresponding to physical locations, such as booth demo stations, presentation halls, or partner collateral.
- Define Parameter Overlays: Attach custom parameters defining campaign context where supported.
- Export Parameterized URLs: Download structured link lists for physical print production.
Field marketing operations can configure channel hierarchies where supported within the OpoInstall developer console.
Exporting High-Resolution Vectors with Custom Logo Overlays
Physical print production requires vector graphic formats (such as SVG or EPS) or sufficiently high-resolution rasters verified for the target print dimensions. Raster images scale poorly when enlarged for massive trade show backdrops, resulting in pixelation that prevents camera sensors from resolving data modules.
When generating business QR codes through an enterprise console, operations teams can export high-resolution assets:
- Embedded Brand Icons: Centering an enterprise logo within the barcode can improve visual recognition. Ensure that the embedded graphic does not obscure critical alignment patterns or exceed the mathematical error-correction capability of the matrix.
- Integrated Framing and Call-to-Action (CTA): Barcodes should incorporate high-contrast outer frames containing explicit instructions, such as “Scan to View Conference Schedule” or “Scan for On-Site Demo.” Clear framing guides attendee expectations and supports higher interaction rates.
To review architectural frameworks for enterprise offline attribution pipelines, explore the mobile attribution implementation reference.
When Is Event Based Barcode Tracking Necessary for Growth
Suitable Conditions for Event-Based Barcode Tracking
Implementing parameterized business QR code tracking delivers clear utility under specific field marketing conditions:
- Substantial Sponsorship Expenditures: Trade shows, industry expos, and conventions with significant marketing investments requiring verified reporting to justify budget renewals.
- Multi-Booth and Multi-Representative Deployments: Events where multiple sales engineers or regional teams operate simultaneously, requiring channel segregation to evaluate placement performance.
- App-Centric Event Experiences: Conventions where the mobile application serves as the primary tool for attendee networking, agenda navigation, lead exchange, or product interaction.
- High-Value User Acquisition: B2B, enterprise SaaS, or fintech verticals where acquiring qualified decision-makers justifies detailed tracking overhead.
Unsuitable Conditions for Event-Based Barcode Tracking
Conversely, complex parameterized barcode tracking introduces unnecessary overhead in low-complexity scenarios:
- Small Internal Corporate Gatherings: Closed internal employee summits where attendee identities are already cataloged and app installation is managed via enterprise mobility tools.
- Zero-App Informational Presentations: Educational seminars where attendees are directed to public documentation or static whitepapers with no mobile application conversion goal.
- Low-Traffic Informal Meetups: Community meetups with small attendance where direct personal relationships replace programmatic channel attribution.
Common Misconceptions in Event Attribution Strategy
- Misconception 1: A Single QR Code Is Sufficient for an Entire Trade Show: Deploying the same barcode across booth banners, table flyers, and presentation slides pools all scan data into a single bucket. This obscures performance differences between passive foot traffic and high-intent demo attendees.
- Misconception 2: Attendees Will Manually Enter Promo Codes in Noisy Venues: Expecting users to type a multi-character coupon code during a crowded exhibition introduces severe onboarding friction. Automated parameter recovery upon initial app launch is critical to maximizing conversion completion where supported.
Frequently Asked Questions (FAQ)
How to track event attendee app downloads using business QR codes?
Can one business QR code route both iPhone and Android users to the correct store?
What is the average scan-to-install conversion rate at B2B conferences?
Summary and Event ROI Framework
Using a parameterized QR code for business transforms offline conference marketing from an unquantifiable expense into a measurable acquisition channel. By capturing scan telemetry, automating cross-platform store redirection, and tracking post-install engagement back to specific physical booths where supported, growth teams justify event sponsorship spend with verifiable data.
As event marketing becomes more data-driven, organizations can use parameterized URLs, observed scan events, supported attribution mechanisms, and incremental financial analysis to evaluate offline campaigns. OpoInstall can be assessed as part of the mobile attribution and deep-linking stack; teams should verify the actual routing, reporting, and SDK capabilities available in their deployed release before relying on them for business decisions.
Related Materials
-
Concepts: QR Code for Business, QR Code Tracking, Offline Conversion Funnel, Channel Attribution
-
Technologies: Mobile Measurement Partner, Edge Redirection Gateway, User-Agent Sensing, Web JS SDK
-
Standards: W3C User-Agent String Guidelines, URI Generic Syntax (IETF RFC 3986)
-
APIs: Google Play Install Referrer API, W3C Fetch API
-
Official Documentation & References:
Share this article