How do fraudsters steal organic app installs? Fraudsters steal organic app installs by flooding attribution platforms with low-intent or simulated clicks, manipulating last-touch attribution models to claim credit for users who naturally intended to download the application.
Organic install cannibalization is an ad fraud exploit where malicious actors manipulate attribution touchpoints to claim credit and marketing commissions for organic, word-of-mouth, or brand-driven application installations. By generating massive volumes of background click telemetry or executing timing arbitrage before store downloads, fraudulent sources siphon marketing budgets while artificially inflating measured paid channel performance.
| Term | Definition | Related Entity | Search Intent Role |
|---|---|---|---|
| Ad Fraud | The deliberate exploitation of attribution pipelines to siphon marketing spend. | Attribution Hijacking | Informational / Security |
| Organic Install Cannibalization | The misattribution of natural user installations to fraudulent paid campaigns. | Click Flooding | Commercial / Analytical |
| Click-to-Install-Time | The elapsed duration between an ad interaction and the application first launch. | MTTI Distribution | Technical / Informational |
The Mechanics of Organic Install Cannibalization in Mobile Ad Fraud
Defining Organic Cannibalization and Unearned Media Costs
Organic install cannibalization represents a structurally damaging form of performance marketing misallocation. In an ideal acquisition environment, organic installs occur without direct media spend: a user discovers an application via word-of-mouth, direct brand search, app store browsing, or public relations, downloads the package directly from an app store, and launches it. These installs carry no directly attributed paid-media Cost-Per-Install (CPI) payout for that specific conversion, although the business may still incur foundational brand, app store optimization (ASO), content, or referral costs.
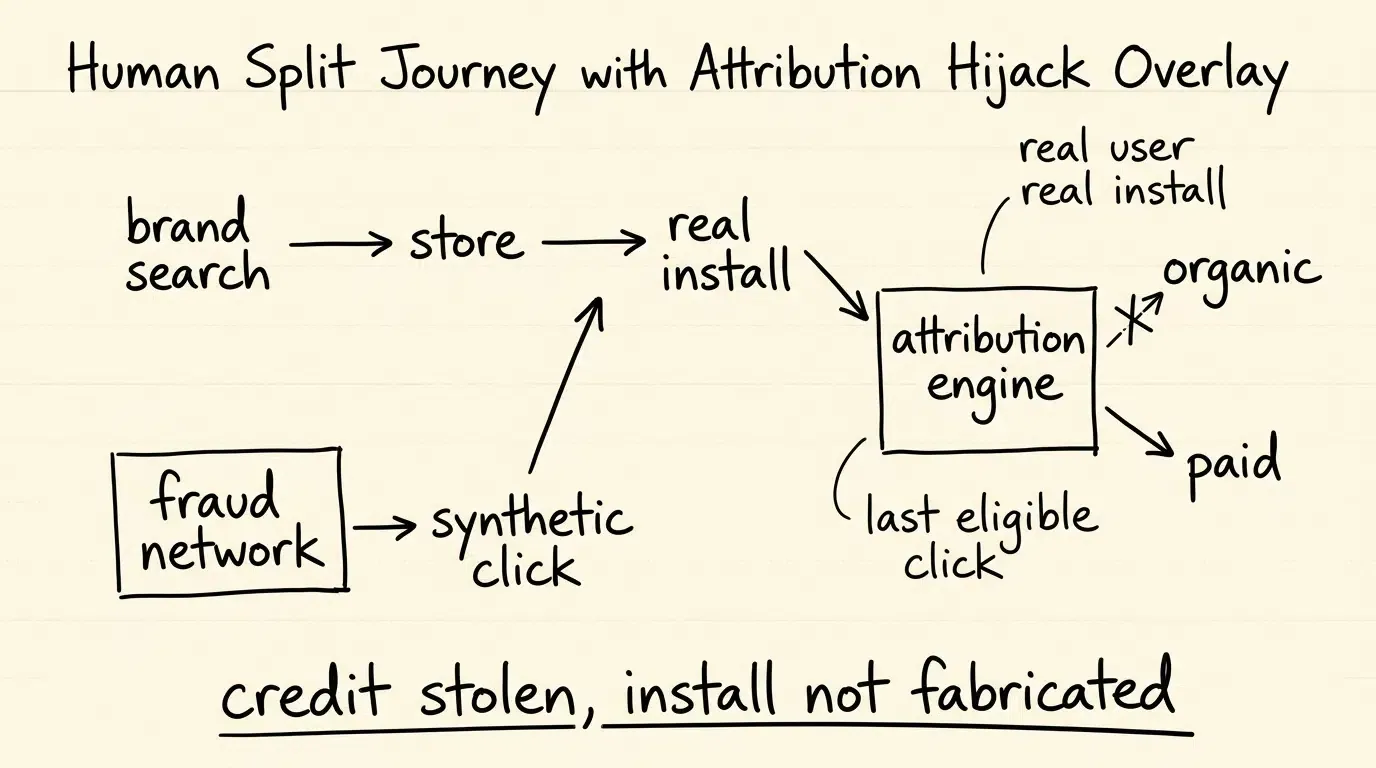
Organic cannibalization occurs when a fraudulent publisher or ad network inserts a synthetic or low-intent touchpoint into the measurement pipeline immediately prior to an organic download. When the user opens the application, the attribution engine assigns the conversion to the fraudulent paid ad rather than registering it as an unassisted organic install. The advertiser is billed a full CPI or Cost-Per-Action (CPA) commission for an install that would have materialized without paid ad intervention.
The Structural Vulnerability of Last-Touch Attribution Models
The underlying technical vulnerability enabling organic theft is the reliance on standard last-touch attribution models paired with broad lookback windows. Under standard last-click attribution rules, the marketing channel responsible for the final recorded interaction prior to an application’s first launch receives 100% of the conversion credit, provided that click occurred within the established lookback window.
Last-touch attribution assumes that touchpoint proximity indicates causal influence. Fraudulent actors exploit this assumption by generating a continuous barrage of background clicks across large device populations. Because standard attribution engines do not measure user intent or cognitive attention, any real-world organic install that coincides with a previously placed speculative click is misattributed to the fraudulent network.
Economic Distortion Across Marketing Budgets and Performance Metrics
The commercial damage of organic poaching extends beyond wasted CPI payouts. When attribution systems misattribute organic users to paid campaigns, reported Return on Ad Spend (ROAS) and Customer Acquisition Cost (CAC) become fundamentally corrupted. Marketing leadership views inflated paid conversion numbers and interprets the fraudulent channel as a top-performing acquisition source.
Consequently, growth teams allocate more budget to the fraudulent network, accelerating capital misallocation. Meanwhile, organic baseline metrics appear to deteriorate, prompting marketing teams to increase paid spending to compensate for the perceived loss in natural growth. This dynamic creates an artificial dependency on fraudulent channels to maintain install velocity.
How Click Flooding and Timing Arbitrage Poach Natural Installs
Mechanics of Click Flooding and Synthetic Touchpoint Delivery
Click flooding (also referred to as click spamming) is the primary technical vector used to execute organic install cannibalization. Malicious publishers deploy various tactics to generate high volumes of unprompted clicks from user devices without user awareness:
- Invisible Web View Rendering: Ad placements load transparent, 1x1 pixel hidden web views within utility or casual gaming applications, automatically cycling through redirect URLs to fire clicks for hundreds of apps.
- Background Ad Impression Cycling: Applications execute background HTTP requests to ad server click trackers whenever an ad impression is rendered, effectively turning display impressions into artificial clicks.
- Touch Event Interception: Applications register user interactions (such as taps in a casual game or scrolling through a content feed) and attach synthetic click events to unrelated external tracking links in the background.
- Server-Side Click Generation: Automated server networks execute programmatic HTTP requests directly to tracking endpoints, simulating click streams without active user participation.
Timing Arbitrage and the Exploitation of Extended Lookback Windows
Click flooding operates on statistical probability rather than targeted influence. A fraudulent network operating across millions of devices generates high volumes of background clicks across top-charting applications.
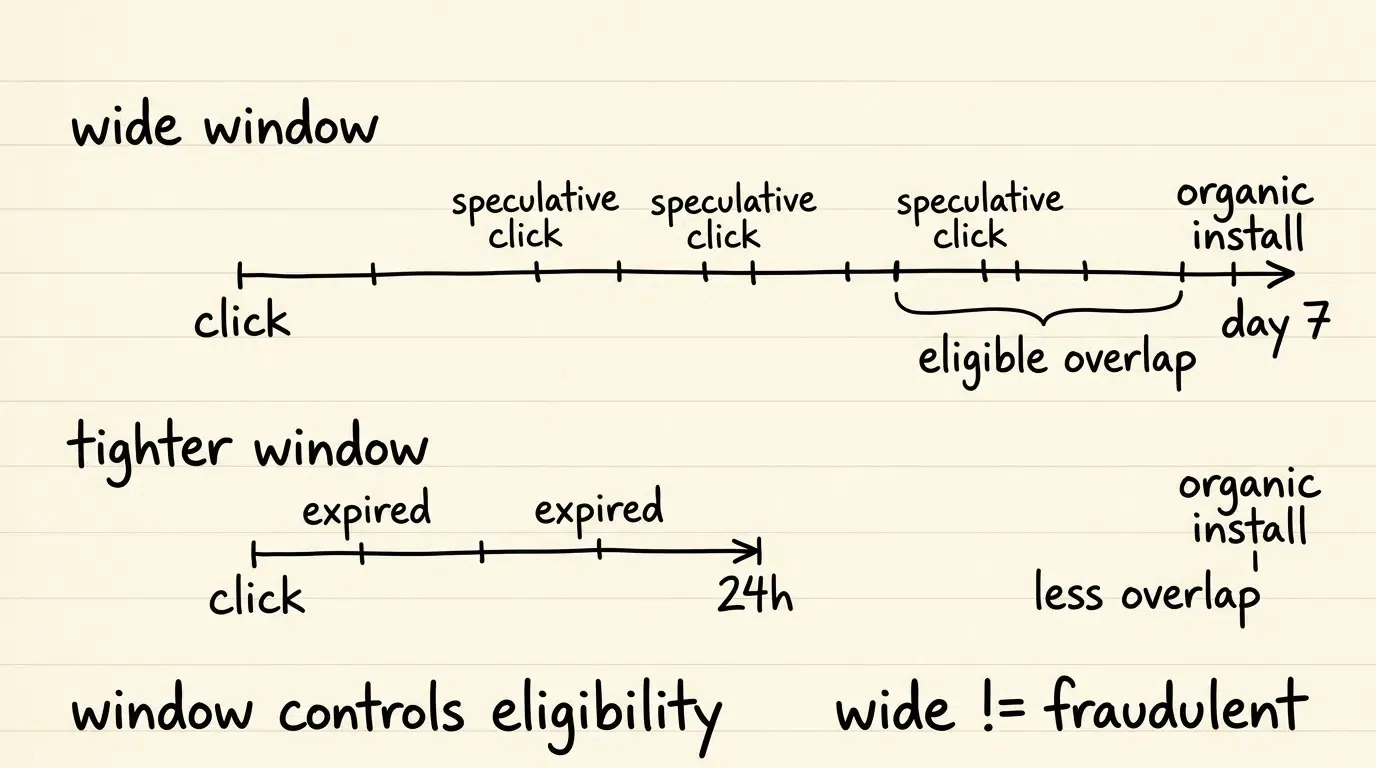
As time since a genuine ad interaction increases, attribution confidence generally weakens and the likelihood of random overlap with unrelated organic downloads grows. If an advertiser maintains an extended multi-day click-through attribution window, any user who naturally downloads the app within that multi-day window after an invisible background click will have their install claimed by the fraudster. The fraudster does not need to know which specific users intend to install the application; by maximizing the density of background clicks across the broader population, they maximize the mathematical likelihood that an organic conversion will land inside their active lookback window.
Target Selection: Why High-Velocity Organic Apps Face Elevated Risk
The commercial economics of click flooding make high-volume applications especially attractive targets because a large legitimate-install base increases the opportunities for random attribution overlap.
Niche or low-velocity applications experience lower absolute fraud volumes because the probability of an organic user downloading the app within a given window is limited, yielding lower returns on the infrastructure required to generate clicks. However, lower-volume apps remain vulnerable if their organic install volume suddenly spikes due to offline marketing, viral features, or seasonal campaigns.
Why Does Organic Poaching Distort Blended CAC and True Marketing ROI
The Inverse Volume Correlation: Rising Paid Installs Mirroring Organic Drops
A primary diagnostic indicator of organic install cannibalization is an inverse volume correlation between paid acquisition volume and organic baseline volume. Paid marketing campaigns may generate positive brand spillover, remain neutral, or substitute for some organic demand depending on channel and market.
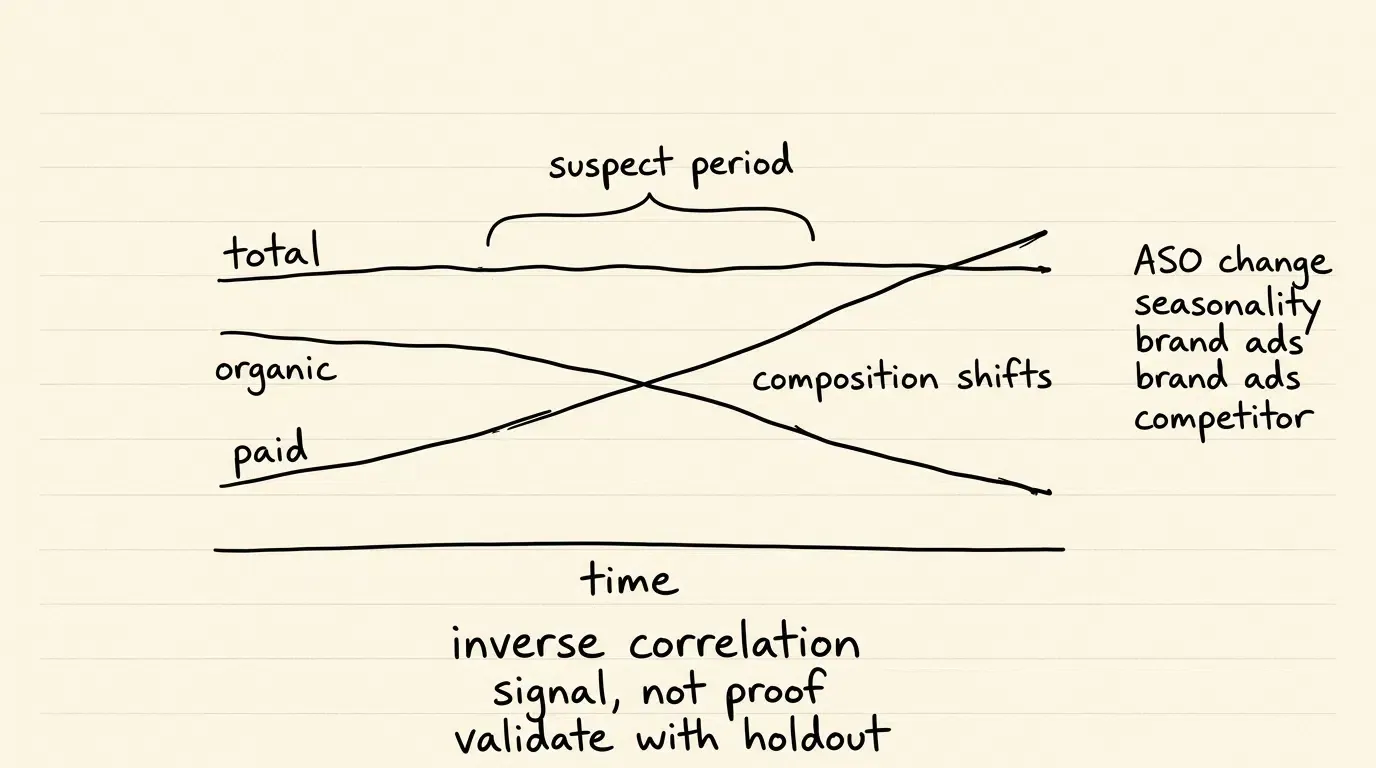
When click flooding networks enter an acquisition mix, an abnormal inverse dynamic frequently emerges. As spend on the suspect channel increases, reported paid installs scale upward while recorded organic installs drop by a comparable margin:
Total gross installs remain relatively flat, but the composition shifts from zero-cost organic conversions to high-cost paid conversions.
Divergence Between Paid CPI and Blended Acquisition Costs
To identify attribution cannibalization, financial analytics teams must evaluate both Paid Cost-Per-Install (Paid CPI) and Blended Cost-Per-Install (Blended CPI) concurrently.
Paid CPI evaluates campaign efficiency based strictly on paid conversions reported by attribution dashboards:
Blended CPI measures holistic acquisition efficiency across the entire application ecosystem, incorporating both paid and organic installs:
When an acquisition channel drives genuine incremental growth, both Paid CPI and Blended CPI remain stable or improve. Under organic cannibalization, Paid CPI appears exceptionally low because the network claims credit for high-converting organic users, while Blended CPI climbs steadily because total gross volume remains static while ad spend increases.
Quantifying the Organic Baseline Deficit
To evaluate potential cannibalization, data teams estimate an Organic Baseline Deficit (
To assess potential financial exposure, data teams calculate an illustrative upper-bound scenario value:
This represents a scenario-based upper-bound exposure if the entire modeled organic deficit were ultimately validated as displaced attribution; it is not an immediate, confirmed fraud loss.
To evaluate how cannibalization risks alter unit economics, analytics teams can model a Scenario-Adjusted Incremental CPI:
Where
Correlation Is a Diagnostic Signal Not Causal Proof
An inverse correlation between paid and organic volume (
- App Store Search Ranking Shifts: Keyword ranking losses or feature placements on app store homepages directly alter organic visibility.
- Competitor Market Moves: Aggressive bidding by competitors on branded search terms can siphon natural traffic before it reaches the app store page.
- Seasonality and Macro Demand: Natural consumer demand cycles introduce weekly or seasonal contractions in organic installation velocity.
- Legitimate Paid Search Substitution: Branded search ads often capture users who would have otherwise scrolled to select the organic search result.
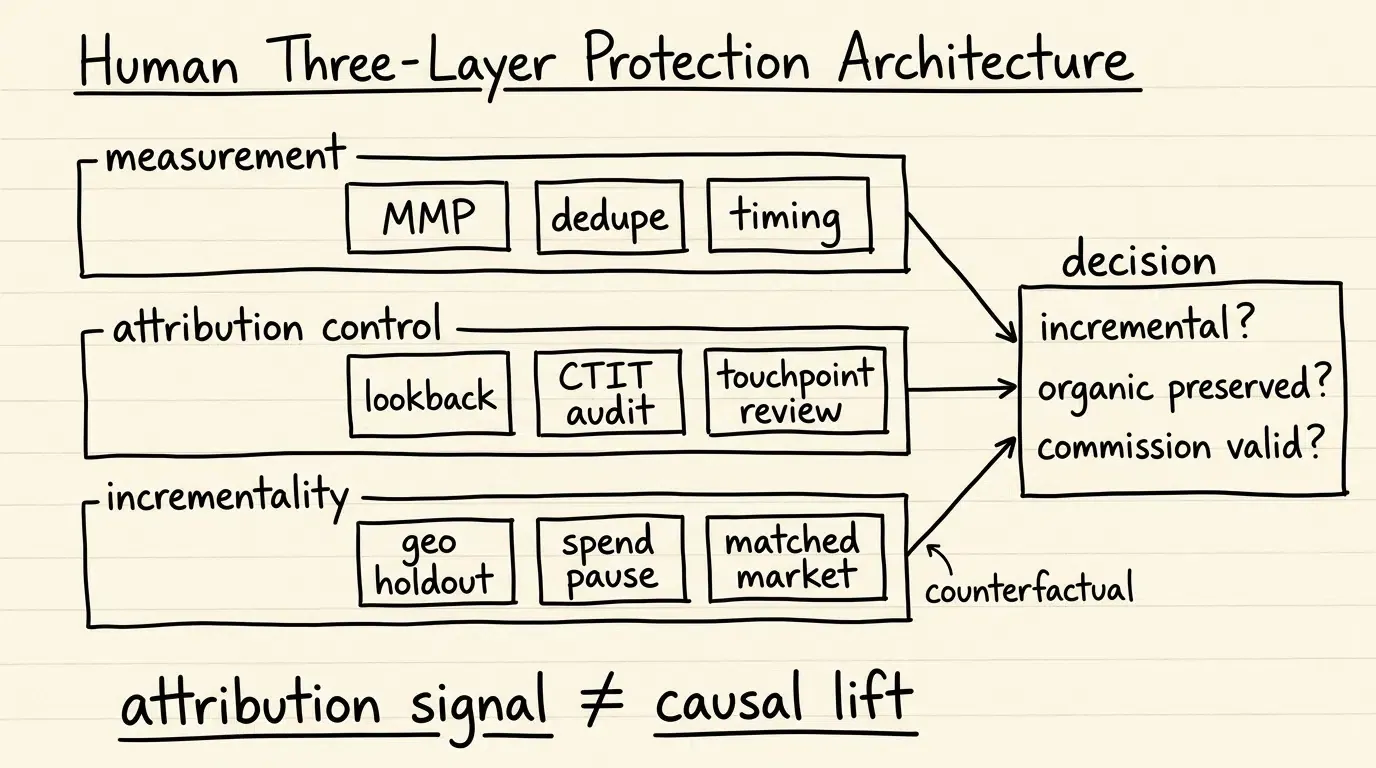
Recent empirical literature on mobile advertising demonstrates that the causal relationship between paid advertising and organic adoption is complex; large-scale marketing spend shutoff experiments have demonstrated that paid media can produce positive incremental organic lift rather than pure displacement. Therefore, observed baseline deficits must be treated as a trigger for diagnostic investigation. Definitive validation requires combining timing and attribution telemetry with controlled causal experiments, such as geographic holdouts, matched-market testing, or structured spend-pause evaluations.
How Does Click to Install Time CTIT Expose Organic Theft
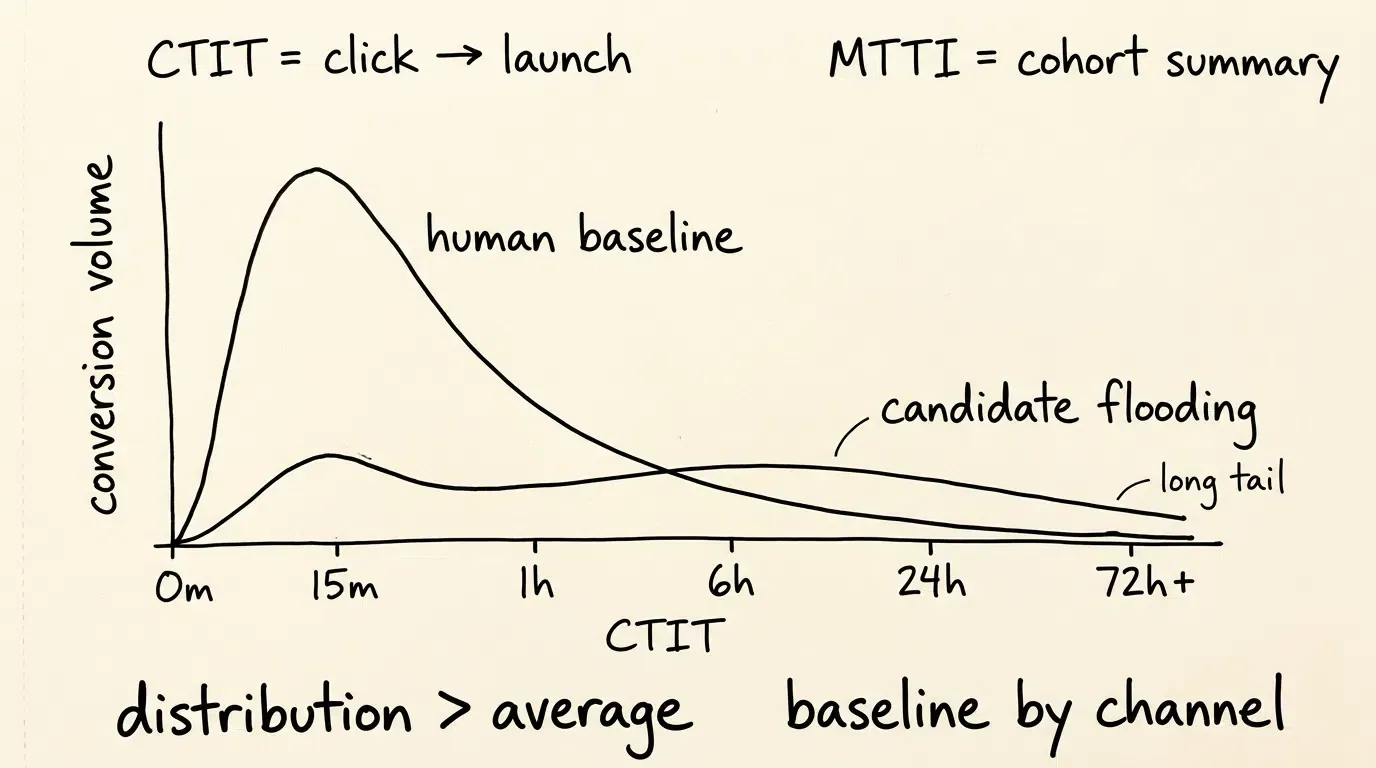
Defining CTIT Latency Profiles and Differentiating from MTTI
Evaluating installation latency requires clear technical distinction between Click-to-Install Time (CTIT) and Mean Time to Install (MTTI):
- Click-to-Install Time (CTIT): Measures the exact elapsed time interval between a recorded ad interaction (click) and the first launch of the installed application for an individual user:
- Mean Time to Install (MTTI): Represents the arithmetic mean or aggregated summary of CTIT across an entire cohort of attributed installs.
Relying exclusively on MTTI obscures critical distribution details, as a single summary average can easily mask anomalies. Effective fraud analysis requires inspecting the entire CTIT probability distribution curve rather than evaluating cohort averages alone.
Natural Human Latency Profiles versus Synthetic Flat-Tail Curves
Analyzing CTIT distribution curves provides empirical evidence to differentiate human engagement from click flooding. Genuine human ad interactions exhibit a pronounced, right-skewed latency distribution. Users who deliberately click a mobile ad typically redirect to the app store, download the package, and open the app within minutes.
Industry anti-fraud vendors report illustrative first-hour concentration benchmarks ranging from approximately 75% in AppsFlyer guidance to over 85% in Adjust distribution-modeling research. These reference figures reflect specific vendor and app cohorts rather than universal performance thresholds, as baseline CTIT curves vary according to package size, market connectivity, ad formats (such as video versus display banners), and store mechanisms.
Human vs. Click Flooding CTIT Distribution Curves:

Conversion
Volume
  |      /\
  |     /  \   <-- Genuine Human Interaction (Pronounced Early Peak, Rapid Decay)
  |    /    \
  |   /      \________________________
  |  /                                \
  | /      ============================  <-- Click Flooding / Timing Arbitrage
  |/                                         (Flatter, Uniform Long-Tail Distribution)
  +------------------------------------------------------------>
  0m   15m   1h    6h    12h   24h   48h   72h   Multi-Day (Time Elapsed)
Auditing Click-to-Install-Time Distributions to Identify Anomaly Clusters
Click flooding networks produce an entirely different distribution profile. Because speculative background clicks are generated continuously across large populations without user intent, the probability of an organic install coinciding with a fake click is distributed randomly across time.
Consequently, click flooding generates a flatter, longer-tailed CTIT distribution with a substantially weaker early-install peak compared to legitimate traffic. If an ad channel exhibits an unusually flat conversion volume from hour 6 through day 7, with little to no concentration in the initial post-click window, the channel warrants inspection for speculative timing arbitrage.
Visualizing the Click Flooding Pipeline against Natural Organic Journeys
The diagram below contrasts a legitimate organic user journey against a speculative click flooding interception flow:
Natural Organic User Flow:
[User Brand Awareness] ──────> [Visits App Store Directly] ──────> [Installs & Launches App]
                                                                               │
                                                                               ▼
                                                                   (Attributed to Organic)

Click Flooding Cannibalization Flow:
[Fraudulent Network] ──> [Floods Device with Silent Clicks] ──┐
                                                             ▼
[Natural User] ──────> [Visits App Store Directly] ──────> [Installs App] ──> [Attribution Engine]
                                                                                    │
                                                                                    ▼
                                                                         (Attributed to Paid Fraud)
Technical Framework for Organic Attribution Protection and De-Duplication
The Role of an Independent Mobile Measurement Partner
Mitigating organic install theft requires an independent Mobile Measurement Partner (MMP) that provides a measurement layer separate from media sellers. Ad platforms that rely exclusively on internal self-attributing logic may evaluate conversions according to platform-specific rules, making cross-channel reconciliation and incrementality testing critical for advertisers.
An independent measurement platform ingests raw touchpoint telemetry across all media sources, applies consistent configured de-duplication and timing rules across supported media sources, and evaluates competing claims against common timestamp and attribution rules. On Android platforms, Google Play Install Referrer timestamps (click timestamp and install-begin timestamp) provide an independent secondary timing check to verify whether install initiation preceded or followed the recorded click.
Restricting Attribution Lookback Windows to Mitigate Touchpoint Flooding
An effective operational lever to limit click flooding exposure is the calibration of attribution lookback windows. While ad networks may request extended multi-day lookback windows, genuine mobile ad intent rarely spans several days without re-engagement.
Shortening a click-through attribution window—for example, from a configured multi-day window (such as 7 days) to 24 or 48 hours—substantially reduces the temporal surface area where random background clicks can overlap with unrelated organic downloads. The optimal window duration should be calibrated empirically against observed CTIT decay curves and verified through incrementality testing to avoid dropping legitimate delayed conversions.
Structuring the Multi-Channel Attribution Audit Record
To audit suspect channels and support reconciliation discussions, data engineering teams can log multi-touch telemetry within an immutable analytical schema. When an installation occurs, the attribution engine captures the winning touchpoint, records CTIT latency, cross-references baseline expectations, and logs diagnostic flags.
The schema placeholder below illustrates an attribution audit record structured to evaluate potential organic cannibalization indicators:
{
  "reference_architecture": true,
  "illustrative_thresholds": true,
  "attribution_audit_record": {
    "audit_metadata": {
      "audit_id": "aud_cannibalization_2026_0909_001",
      "timestamp_utc": "2026-09-09T07:45:00.120Z",
      "app_id": "com.example.enterprise.app",
      "evaluation_engine": "OpoInstall Cheating Monitoring Reference Architecture"
    },
    "conversion_context": {
      "install_id": "inst_77492019_abc",
      "install_timestamp_utc": "2026-09-09T07:44:30.000Z",
      "attributed_channel": "partner_ad_network_delta",
      "campaign_id": "cmp_scale_q3_09",
      "payout_model": "CPI",
      "commission_rate_usd": 2.50
    },
    "touchpoint_telemetry": {
      "winning_click_timestamp_utc": "2026-09-03T11:15:00.000Z",
      "click_source_type": "in_app_display",
      "reported_click_to_install_seconds": 505770.0,
      "reported_click_to_install_days": 5.85,
      "attribution_window_applied_days": 7
    },
    "ctit_statistical_audit": {
      "metric_evaluated": "Click-to-Install-Time (CTIT)",
      "cohort_summary_mtti_hours": 74.2,
      "channel_cohort_ctit_profile": "flatter_long_tail_distribution",
      "observed_early_hour_ratio": 0.12,
      "illustrative_benchmark_early_hour_ratio": 0.75,
      "statistical_anomaly_flag": true
    },
    "organic_baseline_impact": {
      "modeled_counterfactual_organic_baseline_daily": 12000,
      "observed_organic_daily": 8400,
      "estimated_organic_baseline_deficit_daily": 3600,
      "inverse_correlation_flag": true,
      "causal_validation_required": true
    },
    "audit_disposition": {
      "disposition_state": "suspected_organic_cannibalization_flagged",
      "postback_status": "pending_policy_evaluation",
      "commission_eligibility_status": "under_review",
      "reason_codes": [
        "CTIT_LONG_TAIL_ANOMALY_DETECTED",
        "ORGANIC_BASELINE_DEFICIT_CORRELATED",
        "LOW_EARLY_HOUR_CONVERSION_RATIO"
      ]
    }
  }
}
Multi-Signal Evaluation and Source Review Thresholds
Automated anti-fraud architectures evaluate channel traffic across multiple diagnostic signals concurrently rather than relying on isolated metrics. Key technical indicators include:
- Early-Window Latency Ratio: Channels displaying an unusually low proportion of installs within the initial hours post-click relative to established historical baselines are flagged for review.
- Click-to-Install Conversion Rates: Rapid expansions in click volume paired with sharp declines in conversion rate often indicate background click spamming across broad device pools.
- Multi-Touch Contributor Rate: Channels that appear disproportionately as secondary or tertiary touchpoints on conversions attributed to other sources may be casting speculative clicks across the broader ecosystem.
Comparative Analysis of Organic Baseline Preservation Strategies
Evaluating Strategic Approaches to Mitigating Attribution Poaching
Protecting organic baselines requires balancing attribution accuracy against marketing reach. Overly restrictive filtering rules risk dropping legitimate delayed conversions, while unconstrained last-touch models invite persistent click flooding.
The matrix below compares primary defense methodologies across operational mechanisms, commercial benefits, and analytical trade-offs:
| Mitigation Strategy | Operational Mechanism | Primary Advantage | Analytical Trade-off |
|---|---|---|---|
| Unchecked Last-Touch | Credits final click within default multi-day lookback window | Simple implementation across media partners | Maximizes exposure to click flooding and organic cannibalization |
| Constrained Lookback Window | Restricts click-to-install window to 24–48 hours | Substantially reduces temporal window for random click overlap | May exclude genuine high-consideration conversions |
| CTIT Distribution Auditing | Evaluates latency curves against empirical baseline models | Identifies flatter, long-tailed click flooding patterns | Requires sufficient conversion volume to calibrate reliably |
| Multi-Touch Adjudication | Distributes or adjudicates credit across multiple qualifying touchpoints | Provides multi-touch engagement visibility | Attribution results become more model-dependent and complex to reconcile |
Reconciling Organic Health in Growth Marketing Operations
Preserving organic baselines requires ongoing alignment between marketing, data, and finance teams. Rather than evaluating ad networks in isolation, growth organizations must establish commercial agreements that tie commission payouts to clean CTIT distributions, verified incremental lift, and independent MMP validation.
Frequently Asked Questions (FAQ)
What is organic install cannibalization in mobile marketing?
How can growth teams detect if an ad network is poaching organic installs?
How does shortening attribution lookback windows protect organic traffic?
Summary and Decision Framework
Preventing organic install cannibalization requires shifting from uncritical last-touch attribution models toward an active, multi-signal auditing framework. Protecting marketing budgets from attribution poaching relies on monitoring the relationship between paid spend and organic baseline health, auditing Click-to-Install-Time (CTIT) distribution profiles, and enforcing rigorous channel de-duplication.
As digital advertising ecosystems expand, marketing and analytics teams must deploy independent measurement architectures that evaluate traffic patterns objectively rather than relying on self-reported network metrics. Implementing calibrated lookback windows alongside real-time anomaly detection enables mobile applications to preserve organic baselines, lower effective blended acquisition costs, and ensure marketing budgets invest in genuine incremental growth.
For platform-specific implementation and anomaly-monitoring controls, review the mobile attribution implementation reference or access the OpoInstall developer console.
Related Materials
-
Concepts: Organic Install Cannibalization, Click Flooding, Click-to-Install-Time, Blended CPI, Attribution Window
-
Technologies: Independent Mobile Measurement Partner, Multi-Touch Attribution, Real-Time Anomaly Engine, S2S Postbacks
-
Standards: IETF RFC 3986 Uniform Resource Identifier Specifications, OWASP Mobile Security Guidance
-
APIs: Google Play Install Referrer API, Apple StoreKit Ad Network API, Channel Statistics Interfaces
-
Official Documentation & Industry Research:
Share this article