Why does click spamming cause discrepancies between clicks and installs? Click spamming causes data discrepancies by generating massive volumes of unprompted background clicks across mobile devices, artificially inflating ad network click metrics while producing severely depressed conversion rates and misattributing organic installations.
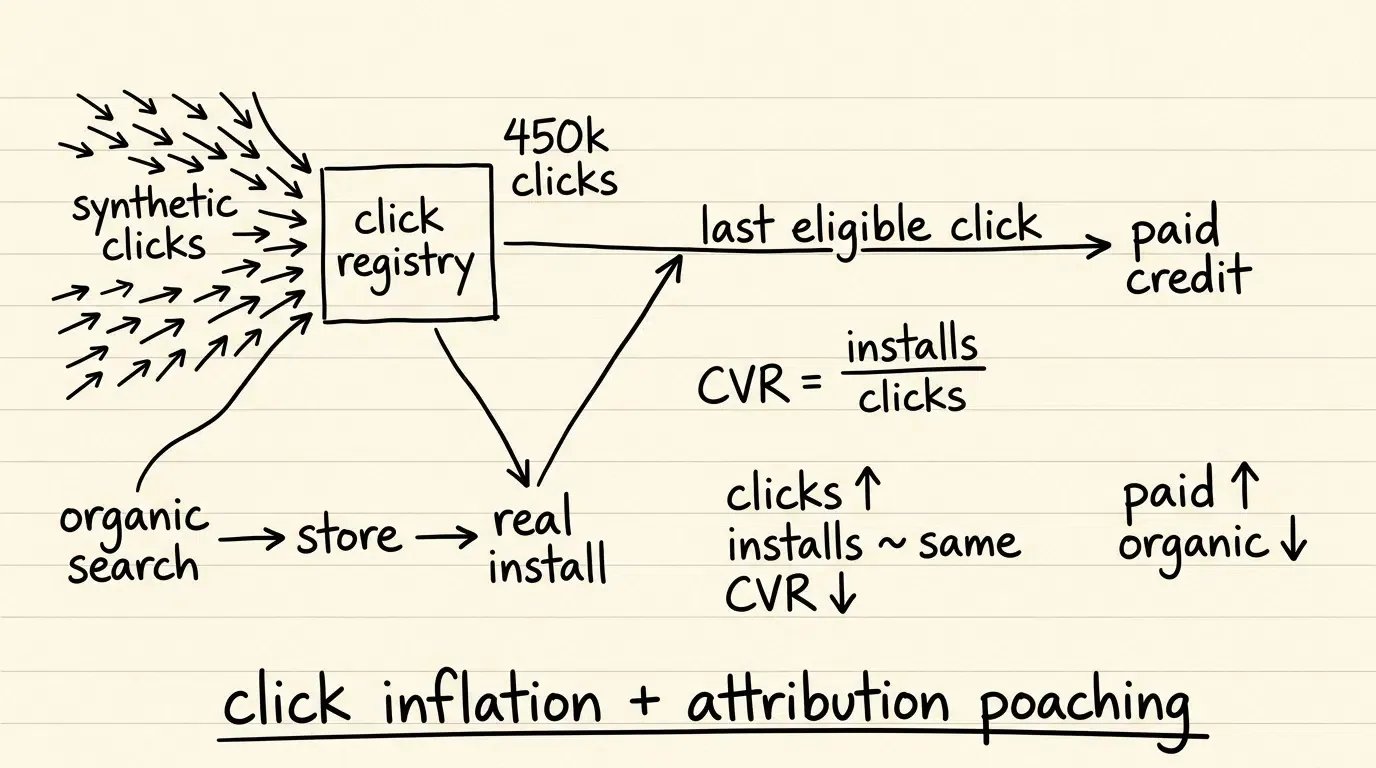
Click spamming, or click flooding, is an attribution fraud vector where bad actors execute high volumes of unprompted, programmatic ad clicks in the background without user intent. In mobile marketing analytics, click spamming creates severe data discrepancies across reporting systems by artificially inflating click volumes, causing conversion rates to collapse relative to channel baselines, and misattributing organic installations.
| Term | Definition | Related Entity | Search Intent Role |
|---|---|---|---|
| Data Discrepancy | A material mismatch between metrics expected to reconcile after accounting for measurement definitions, attribution windows, reporting latency, privacy controls, and deduplication. | Attribution Tracking | Informational / Commercial |
| Click Spamming | The programmatic generation of massive, low-intent clicks to poach organic conversions. | Ad Fraud | Technical / Informational |
| Conversion Tracking | The measurement of valid install and post-install milestones across marketing channels. | Marketing Analytics | Informational |
Why Click Spamming Drives Massive Data Discrepancies in Mobile Marketing
The Ghost Click Epidemic: High-Volume Clicks Yielding Disproportionately Low Installs
In performance marketing analytics, data teams frequently observe statistical anomalies where ad networks report large volumes of ad clicks, yet the corresponding conversion volume on mobile measurement platforms (MMPs) is negligible. This disconnect is a common investigation signal for click spamming.
Unlike legitimate advertising campaigns where click volumes correspond to authentic user interest and predictable downstream install velocity, click spamming floods attribution pipelines with synthetic, unprompted clicks. Fraudulent publishers, compromised ad SDKs, or malicious web scripts generate these clicks in the background without the device owner’s knowledge. Because no human intent exists behind the interaction, the vast majority of these clicks never result in an install, generating significant reporting discrepancies between billed media clicks and verified mobile activations.
The Conversion Rate Collapse: How Click Flooding Depresses Conversion Efficiency
Conversion Rate (CVR)—the ratio of completed installations to total recorded clicks—serves as a primary diagnostic indicator of traffic quality:
In authentic paid campaigns, CVR clusters around predictable, channel-specific empirical baselines. When click flooding infiltrates a campaign, the denominator (clicks) expands by orders of magnitude while the numerator (installs) remains constrained by real-world human behavior.
Consequently, observed conversion rates tend to depress relative to the channel’s own legitimate baseline. This statistical depression creates operational friction during performance reviews: marketing teams cannot determine immediately whether a campaign failed due to unappealing ad creatives or because attribution tracking was polluted by background click storms.
Organic Cannibalization: How Spammed Clicks Falsely Reclassify Natural Installs as Paid Conversions
The underlying economic objective of click spamming is attribution poaching. Fraudsters do not expend resources building automated device farms to download applications; instead, they target real users who already intend to download the application organically.
By continuously spraying synthetic clicks across active mobile devices, click spammers maximize the probability that an active click timestamp exists on their network whenever a user naturally downloads the app via organic search or direct brand navigation. Under standard last-touch attribution rules, the measurement engine matches the natural install to the spammer’s pre-existing click.
This creates a dual reporting distortion:
- Depressed Organic Baselines: Internal business intelligence (BI) systems report declining organic acquisition volume, falsely suggesting that brand momentum is decaying.
- Inflated Paid Acquisition Costs: Performance marketing budgets are billed for organic users who would have installed the application without paid media exposure.
Developers seeking lightweight client telemetry and attribution SDKs can explore packages via the mobile analytics SDK package.
How to Account for Non-Fraud Discrepancies Before Investigating Click Spamming
Systematic Reconciliation Controls Prior to Fraud Attribution
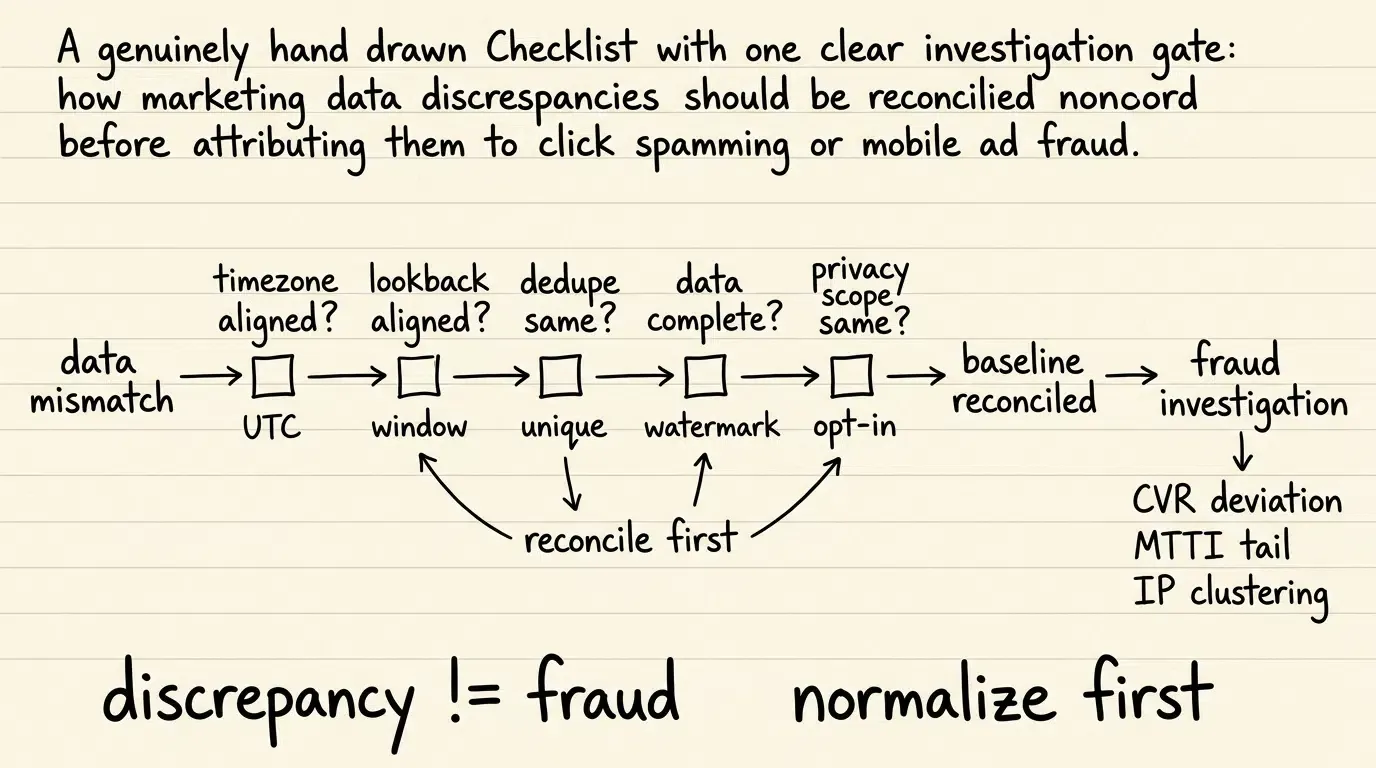
Before attributing reporting divergence to click spamming or other malicious ad fraud vectors, data engineering and analytics teams must eliminate standard, non-fraudulent causes of data discrepancy. Mismatches across ad network dashboards, MMPs, and internal BI warehouses frequently stem from configuration, timing, or structural definition variances:
- Timezone Normalization: Ensuring that reporting systems are aligned to a single reference timezone (such as UTC). Comparing daily aggregations where one platform uses local advertiser time and another uses UTC creates artificial discrepancy spikes.
- Attribution Lookback Window Alignment: Verifying that reporting parameters share identical click-through and view-through window configurations. Mismatched lookback settings cause attribution platforms to accept or reject conversions that ad networks calculate differently.
- Event Definition and Deduplication Rules: Confirming whether systems evaluate raw conversion events or deduplicated unique user installations. Discrepancies often emerge when ad networks report gross conversion attempts while MMPs apply strict device deduplication.
- Reporting Latency and Data Completeness: Accounting for asynchronous processing queues, postback delivery delays, and platform-specific data ingestion watermarks (such as App Store Connect data completeness delays) before evaluating conversion deltas.
- Privacy Thresholds, Opt-In Scope, and Statistical Noise: Accounting for platform privacy frameworks that suppress low-volume cohort cells, restrict tracking to opt-in user scope, or introduce statistical noise, creating apparent gaps when compared against unmasked warehouse logs.
How Does Click Spamming Artificially Inflate Click Metrics and Depress CVR
The Mechanics of Background Click Generation: Invisible WebViews and Impression Conversion
Click spamming relies on hidden technical execution vectors embedded within mobile websites, third-party advertising SDKs, or compromised utility applications:
- Hidden WebViews: Malicious apps instantiate hidden webviews in the background, loading tracking URLs and executing programmatic click scripts continuously while the user interacts with an unrelated game or utility.
- Impression-to-Click Conversion: Rogue ad networks convert passive ad impressions into click events automatically, bypassing intentional user interaction.
- Pop-Under Redirects and Hidden Iframes: Web landing pages execute hidden iframe sequences that cycle through affiliate tracking redirects in milliseconds, planting tracking parameters on the user’s browser session.
Exploiting the Attribution Lookback Window: Casting a Net Across Active Devices
Mobile measurement platforms enforce configured attribution lookback windows. The lookback window defines the maximum allowable time delta between an ad click and an application install:
Click spammers exploit this multi-day window by treating attribution as a statistical probability game. By generating high volumes of synthetic clicks daily, a fraudulent network blankets a substantial percentage of the regional mobile user base. When any of those users organically downloads the target application within the lookback window, the spammer’s click is already present in the attribution registry, claiming unearned conversion credit.
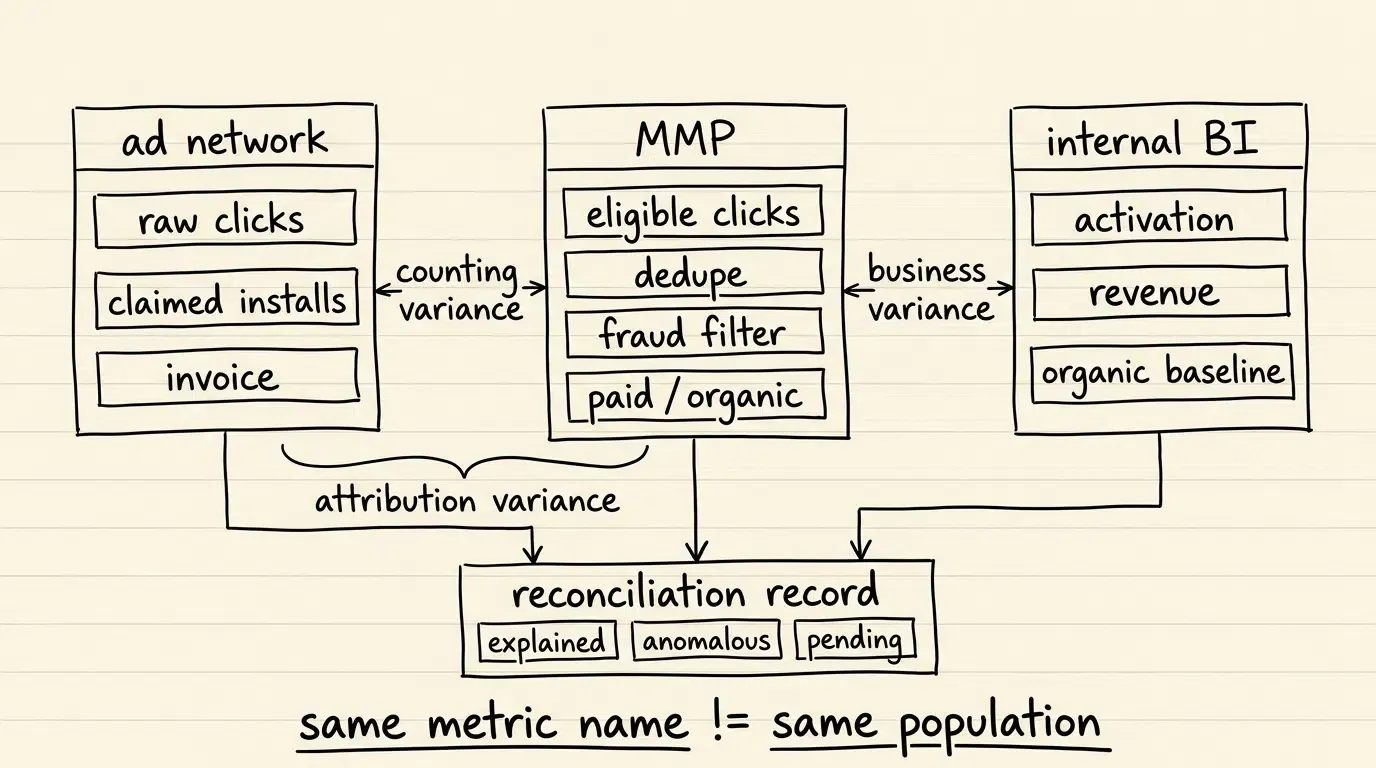
Anatomy of Reporting Divergence Between Ad Networks, MMPs, and Internal BI
The Ad Network Perspective: High Click Volume and Claimed Conversions
From the perspective of the ad network dashboard, the campaign appears active and high-volume. The network logs ad requests, impressions, and outbound click redirects delivered across its publisher inventory, billing advertisers for gross click volume or claiming attribution credit for every install where its click timestamp occupied the final position.
The MMP Perspective: Multi-Channel De-Duplication and Filter Application
The Mobile Measurement Partner (MMP) functions as the central attribution arbiter, ingesting raw click feeds, timestamping them upon receipt, and applying deduplication logic across competing channels. When validation layers identify synthetic click patterns, they flag or reject the network claim according to configured rules, creating an immediate reporting divergence between ad network dashboards and MMP reporting.
The Internal BI Perspective: Depressed Organic Baselines and Ledger Mismatches
Inside the advertiser’s internal data warehouse, data discrepancies manifest as declining organic acquisition volume alongside unreconciled campaign invoices, requiring structured multi-system auditing.
[Ad Network Publisher Feed] ──► Generates Programmatic Background Clicks
             │
             ▼
   [Ad Network Dashboard]   ──► Reports Inflated Clicks | Claims Install Credit | Bills Client
             │
             ▼
 [OpoInstall Gateway Check] ──► Evaluates MTTI Distribution & Abnormal Click IP Clustering
             │
             ▼
        [Attribution Engine]    ──► Applies Configured Policy / Flags Anomalous Claims
             │
             ▼
   [Internal BI Database]   ──► Reconciles Paid vs. True Organic Baseline Telemetry
How to Use MTTI Curves and Conversion Rate Deviations to Detect Click Flooding
The Signature of Human Clicks: Baseline-Relative Latency Distributions
Evaluating click spamming requires analyzing the distribution of Mean Time to Install (MTTI)—the elapsed time between an ad click and the first application launch. Legitimate human interactions follow empirical baseline distributions shaped by network speed, file size, and store behavior.
The Signature of Click Spamming: Extended Late-Window Tail Distributions
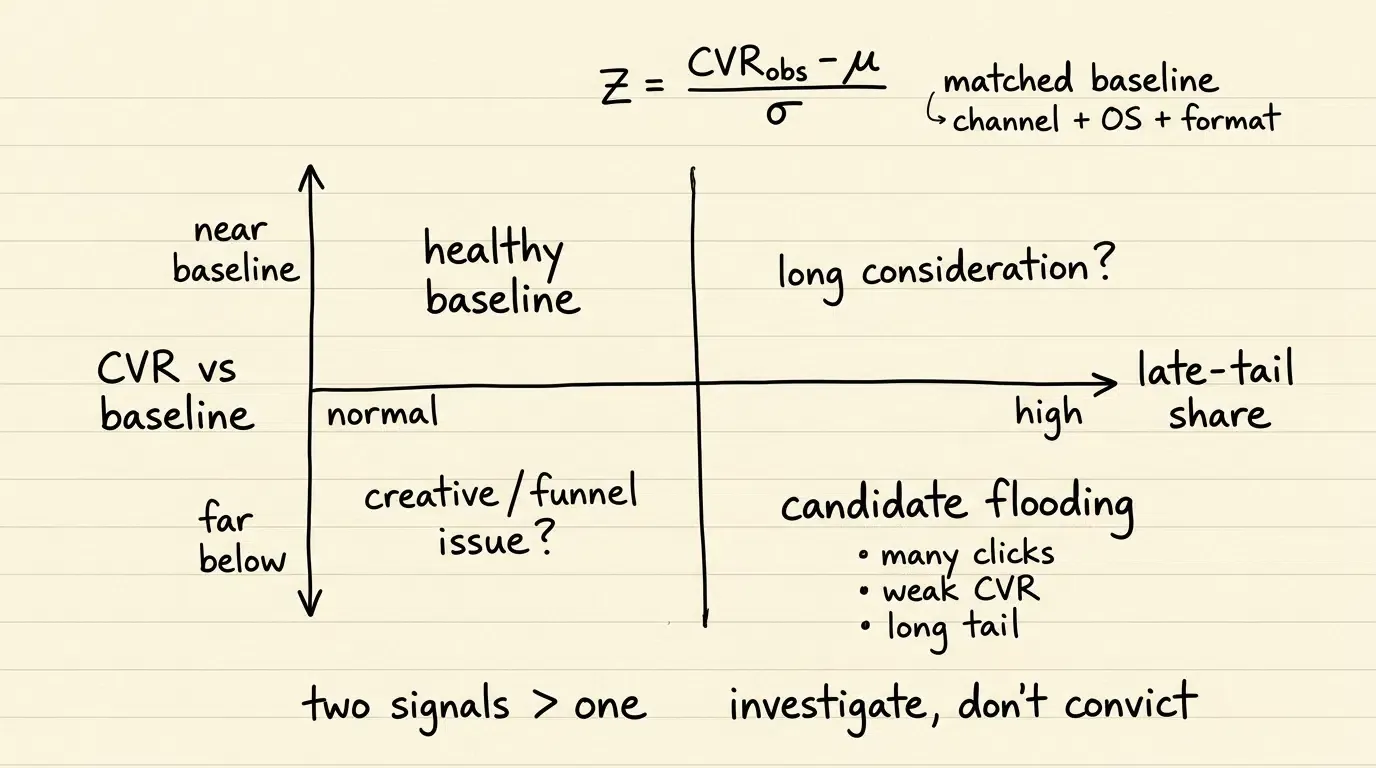
Click spamming exhibits a distinct temporal signature. Because synthetic clicks are fired randomly in the background without user intent, the elapsed duration between a spammed click and a subsequent organic install is arbitrary, producing an unusually extended or weakly decaying late-window distribution across multiple days relative to historical baselines.
Formulating CVR Standard Deviation Anomalies
To automate anomaly detection across acquisition channels, analytics engines compute standardized Z-scores evaluating how far a channel’s observed CVR deviates from the expected channel baseline:
Where:
is the expected mean conversion rate for that specific marketing vertical, ad format, and operating system based on historical clean traffic. is the standard deviation of CVR across historical baseline cohorts.
A sufficiently negative standardized deviation can trigger investigation after minimum-volume and baseline-quality checks; the operating threshold should be calibrated on validated historical traffic rather than treated as a universal constant.
Comparative Evaluation of Reporting Discrepancy Signatures across Acquisition Channels
Contrasting Legitimate Campaign Metrics with Click Spamming Signatures
The diagnostic matrix below contrasts primary attribution hijacking vectors against legitimate marketing traffic:
| Diagnostic Dimension | Click Spamming (Click Flooding) | Click Injection (Install Hijacking) | Legitimate Marketing Campaign |
|---|---|---|---|
| Reported Click Volume | Massively inflated relative to spend | Normal to low | Aligned with media spend and reach |
| Observed Conversion Rate (CVR) | Depressed relative to channel baseline | Normal to high | Standard channel baseline |
| MTTI Distribution Profile | Unusually extended late-window tail | Concentrated left-tail anomaly | Empirical baseline distribution |
| Primary Discrepancy Root | Click inflation vs. real install mismatch | Timing inversion ( |
Lookback windows and timezone shifts |
| Downstream Cohort Retention | Mirrors organic baseline (Poached users) | Mirrors organic baseline (Poached users) | Specific to campaign creative intent |
How to Configure Anti-Fraud Thresholds to Reconcile Marketing Data Discrepancies
Structuring Diagnostic Telemetry Payloads for Click Spamming Audits
Reconciling discrepancies between ad network reports and internal BI ledgers requires ingesting structured anomaly telemetry. When an attribution gateway evaluates incoming clicks and detects click flooding patterns, it logs a comprehensive diagnostic record.
The payload below demonstrates an illustrative production-oriented telemetry record capturing a click spamming anomaly evaluation at the attribution gateway:
```json
{
  "schema_version": "1.2.0",
  "event_id": "evt_discrepancy_7a8b9c0d-1e2f-3a4b-5c6d-7e8f9a0b1c2d",
  "event_name": "attribution_discrepancy_anomaly_detected",
  "evaluation_timestamp_utc": "2026-08-30T20:15:00.120Z",
  "server_received_timestamp_utc": "2026-08-30T20:15:00.850Z",
  "baseline_provenance": {
    "baseline_scope": "vertical_channel_os_matched",
    "observation_window_days": 30,
    "baseline_sample_clicks": 1250000,
    "baseline_version": "v2.4_rc"
  },
  "attribution_context": {
    "channel_code": "affiliate_network_sigma",
    "campaign_id": "cmp_q3_display_scale",
    "reported_network_clicks_24h": 450000,
    "mmp_verified_clicks_24h": 12400,
    "discrepancy_ratio": 36.29,
    "observed_cvr_percentage": 0.008,
    "channel_baseline_cvr_percentage": 2.45
  },
  "anomaly_evaluation": {
    "fraud_vector_classification": "suspected_click_spamming",
    "signals_evaluated": [
      "extreme_cvr_depression",
      "flat_multi_day_mtti_tail",
      "high_density_click_ip_clustering"
    ],
    "cvr_z_score": -4.82,
    "mtti_late_window_share_percentage": 78.4,
    "decision_basis": "statistical_anomaly_policy",
    "policy_action": "flagged_for_review",
    "review_status": "pending_partner_review"
  },
  "ip_telemetry": {
    "client_ip_anonymized": "203.0.113.0/24",
    "subnet_daily_click_count": 84200,
    "unique_user_agents_observed": 1420,
    "is_datacenter_asn": true,
    "asn_identifier": "<asn_placeholder>"
  },
  "device_telemetry": {
    "platform": "Android",
    "os_version": "16.0",
    "app_version": "3.2.0",
    "sdk_version": "<installed_sdk_version>",
    "device_risk_key_pseudonymous": "dev_risk_anon_44556677"
  },
  "audit_trail": {
    "ad_network_claimed_installs": 36,
    "mmp_validated_paid_installs": 2,
    "partner_claims_flagged_count": 34
  }
}
Configuring OpoInstall Cheating Monitoring Rules for Click Flooding Defense
OpoInstall-related technical resources describe comparable anti-fraud monitoring patterns; exact rule names and behaviors should be verified against the current product console and documentation before implementation. Core anti-spamming configuration rules include:
- Click IP Anomaly Threshold: Caps allowable clicks originating from a single IP address within a 24-hour window, marking excess volume as abnormal IP clicks in Exception Statistics.
- Installation Device and IP Anomaly Thresholds: Monitors install frequency across shared subnets, flagging abnormal concentration.
- MTTI Distribution Analysis: Visualizes click-to-install latencies across a product-defined analytical interval model, allowing growth teams to compare candidate channels against aggregate baselines.
- Attribution Policy Enforcement: When an install matches an anomalous click, the rule engine applies configured attribution policies to flag or route the event into an organic or unattributed reconciliation path.
Auditing Exception Statistics: Supporting Partner Billing Reconciliations
When marketing data discrepancies arise during partner billing reviews, data teams utilize analytics and exception statistics to provide diagnostic telemetry records supporting partner review and reconciliation discussions.
When Are Advanced Discrepancy Audits Necessary for Marketing Analytics
Suitable Conditions for Dedicated Discrepancy Reconciliation
Deploying advanced discrepancy auditing and anti-spamming monitoring provides significant operational ROI under specific conditions:
- Multi-Channel Programmatic Operations: Marketing programs deploying budgets across programmatic DSPs and affiliate networks where publisher transparency is limited.
- Significant Discrepancies Between Spend and Growth: Applications observing that scaling paid ad spend correlates with an unexplained drop in organic search install volume.
- Partner Billing Reviews: Teams requiring transparent diagnostic records to review invalid traffic claims during partner reconciliation meetings.
Unsuitable Conditions for Complex Discrepancy Audits
Implementing high-complexity discrepancy auditing infrastructure may introduce unnecessary operational overhead in the following scenarios:
- Single-Source Organic Apps: Applications relying exclusively on unassisted organic app store search with zero active paid acquisition campaigns.
- Closed Self-Attributing Networks Only: Marketing campaigns operating strictly within closed walled-garden networks with zero external third-party attribution webhooks.
Common Misconceptions in Data Discrepancy Analysis
- Misconception 1: Discrepancies Are Exclusively Caused by Timezone Differences: While timezone offsets and reporting delays account for minor variance, large discrepancies warrant investigation for traffic anomalies as well as attribution-window and configuration mismatches.
- Misconception 2: High Click Volume Improves Store Search Rankings: Paying for spammed clicks does not boost app store search visibility; app stores rank applications based on authentic download velocity and user engagement.
Frequently Asked Questions (FAQ)
Why do ad network reports show millions of clicks when my MMP shows very few?
How does click spamming affect organic install reporting?
Which metrics are most useful for identifying click flooding?
Summary and Decision Framework
Data discrepancies between ad network reports, attribution engines, and internal data warehouses can be symptomatic of click spamming activity after normal reconciliation differences have been excluded. By generating massive volumes of unprompted background clicks, bad actors corrupt performance marketing telemetry, depress measured conversion rates, and poach organic attribution credit.
Resolving these discrepancies requires deploying multi-layered cheating monitoring tools capable of identifying statistical CVR deviations, analyzing MTTI distribution curves, and enforcing strict click IP anomaly thresholds. By pairing independent attribution measurement with real-time anomaly detection, platforms like OpoInstall provide the infrastructure required to inspect suspicious traffic, reduce attribution contamination, and support campaign optimization.
To evaluate how unified attribution and cheating monitoring infrastructure can reduce and investigate marketing data discrepancies, explore the mobile attribution implementation reference.
Related Materials
-
Concepts: Data Discrepancy, Click Spamming, Click Flooding, Organic Cannibalization, Mean Time to Install (MTTI), Conversion Rate Collapse
-
Technologies: Cheating Monitoring Engine, Attribution Data Reconciliation, S2S Webhooks, Raw Telemetry Export
-
APIs & Data Interfaces: Attribution Reporting APIs, Exception Statistics Export, OpoInstall Attribution Interfaces
-
Official Documentation & References:
Share this article