How to read a cohort analysis table for app retention? Reading a cohort analysis table requires evaluating rows horizontally to track longitudinal retention decay over time, comparing columns vertically to measure cohort-over-cohort performance across releases, and inspecting diagonals to isolate calendar-day anomalies.
A cohort analysis table is a data matrix that organizes users into shared temporal or behavioral acquisition groups and tracks their recurring engagement over progressive elapsed intervals. By structuring retention data across horizontal, vertical, and diagonal axes, cohort analysis allows product and analytics teams to localize retention shifts associated with product releases, acquisition changes, and calendar-time anomalies.
| Term | Definition | Related Entity | Search Intent Role |
|---|---|---|---|
| Cohort Analysis | The segmentation of user groups to track behavioral retention over time. | Retention Rate | Informational / Commercial |
| Cohort Matrix Grid | A triangular or rectangular table displaying retention percentages across cohorts and elapsed days. | App Analytics | Technical / Informational |
| Retention Rate | The proportion of an initial cohort that logs qualifying active sessions at specific intervals. | User Retention | Informational |
Why Cohort Analysis Is Essential for Auditing App Lifecycle Health
The Pitfall of Aggregated Active User Metrics
High-level active user metrics—such as Daily Active Users (DAU) and Monthly Active Users (MAU)—summarize total active volume, while the DAU/MAU ratio serves as a general engagement-frequency proxy. However, relying exclusively on aggregate volume metrics can mask substantial underlying retention deterioration. A growing DAU curve can obscure poor retention if aggressive top-of-funnel acquisition continuously replenishes a rapidly churning user base.
Consider an illustrative case where an application maintains a stable 100,000 DAU by acquiring 10,000 new installs daily, even though the vast majority of new users abandon the product within 48 hours. If acquisition spend decreases, the hidden retention deficit causes active volume to contract rapidly. Cohort analysis addresses this diagnostic blindspot by isolating discrete user groups based on their acquisition date, enabling teams to evaluate lifecycle decay independently of fluctuating acquisition volume.
Defining the Cohort Anchor: Install Date, Registration Timestamp, or Core Activation Milestone
The integrity of a cohort analysis matrix depends on establishing an explicit, technically verifiable cohort anchor event (
Analytics teams select from three primary cohort anchor models:
- Install-Date Anchor: Groups entities by a platform-defined installation or download date. If an internal data warehouse anchors on initial application open instead, first open should be treated as a distinct anchor rather than conflated with download date.
- Registration-Timestamp Anchor: Groups users by the completion of account creation or identity verification, isolating post-registration engagement from pre-signup acquisition drop-off.
- Core Activation Milestone Anchor: Groups users by the execution of a key functional event (e.g., executing an initial trade, publishing a workspace, or completing a game tutorial). This anchor measures product habituation among qualified, activated cohorts.
Mixing anchor definitions within a single matrix introduces population drift. Every cell in a cohort table must evaluate activity relative to an immutable, uniformly defined baseline set (
Engineers seeking to implement client-side lifecycle telemetry and attribution tracking can evaluate client libraries via the mobile analytics SDK package.

Distinguishing Onboarding Drop-Off from Post-Activation Lifecycle Churn
Auditing mobile lifecycle health requires maintaining an architectural distinction between onboarding drop-off and post-activation lifecycle churn:
- Onboarding Drop-Off (Pre-Activation): Measures sequential abandonment across registration or setup steps before the defined activation milestone. Depending on the cohort anchor, those onboarding steps may occur either before or after
( ). - Lifecycle Churn (Post-Activation): Measures the cessation of engagement by previously active users over extended observation windows (
). In exact-day retention, the complement ( ) represents the non-return share for Day . Lifecycle churn can be operationally classified using a predefined inactivity threshold (for example, zero qualifying sessions across a defined 30-day window) or an explicit terminal event such as account deletion. An inactivity-based churn classification does not imply that the user can never reactivate at a later date.
Cohort analysis focuses on activity occurring after the selected cohort anchor. When the anchor precedes activation, onboarding completion remains a downstream milestone rather than an assumed baseline at
How to Read and Interpret a Standard App Retention Cohort Matrix
Anatomy of the Triangular Matrix: Cohort Identifiers, Baseline Sizes, and Elapsed Day Intervals
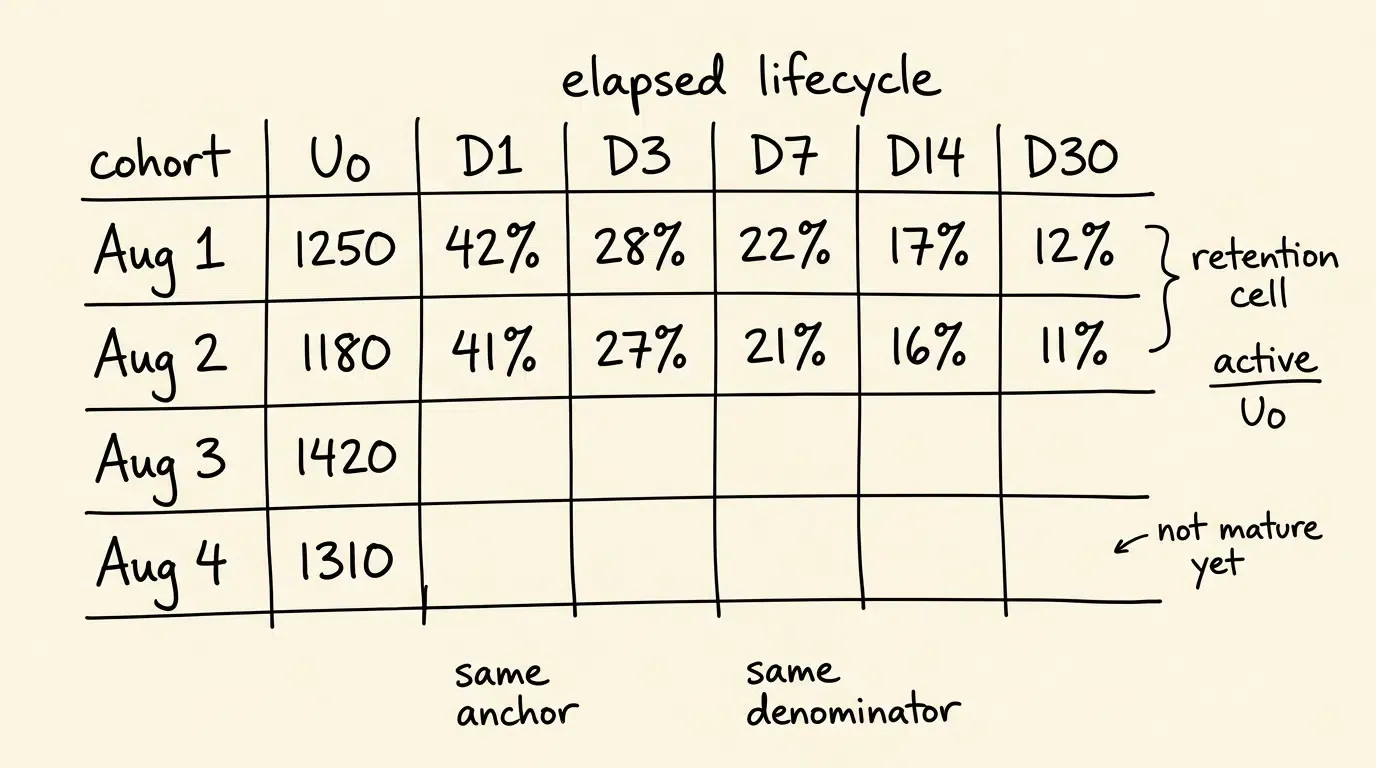
A standard app retention cohort table forms a right-triangular grid. The structure is governed by temporal progression: older cohorts possess complete historical data extending through Day 30 and beyond, whereas recently acquired cohorts display data only for initial elapsed intervals.
The components of a cohort matrix include:
- Cohort Identifier Column (Y-Axis): Identifies the specific cohort anchor date or calendar week (
). - Baseline Size Column (
): Displays the total count of qualifying unique entities that completed the anchor event during that period. - Elapsed Interval Columns (X-Axis): Represents elapsed time intervals relative to the anchor date (
). - Intersection Cells (
): Display the retention percentage of Cohort that logged at least one qualifying active session during elapsed interval .
Mathematical Formulation of Cell Values
To ensure mathematical consistency across analytics pipelines, cell values within a cohort matrix are calculated using strict set semantics.
Let
Where
Let
Where
The retention rate cell value
Standard 30-Day Cohort Retention Matrix Grid
The table below illustrates a standard cohort matrix tracking daily acquisition cohorts across key lifecycle intervals:
| Cohort Anchor Date ( |
Baseline Size ( |
Day 1 ( |
Day 3 ( |
Day 7 ( |
Day 14 ( |
Day 30 ( |
|---|---|---|---|---|---|---|
| 2026-08-01 | 1,250 | 42.4% | 28.0% | 21.6% | 16.8% | 12.0% |
| 2026-08-02 | 1,180 | 41.5% | 27.2% | 20.8% | 16.1% | 11.5% |
| 2026-08-03 | 1,420 | 44.0% | 30.1% | 23.2% | 18.0% | 13.1% |
| 2026-08-04 (App Update v3.2) | 1,310 | 48.5% | 34.2% | 27.5% | 21.4% | 15.8% |
| 2026-08-05 | 1,290 | 47.8% | 33.8% | 26.9% | 21.0% | 15.2% |
*Note: Percentage values represent an illustrative example only.
*Note: Percentage values represent an illustrative example only.
Platform cohort matrices can use platform-specific population rules; for example, App Store Connect excludes installations that have never opened the app from its retention denominator. Platform retention grids may also be affected by opt-in and privacy-threshold rules, so blank cells in platform dashboards should not automatically be interpreted as zero retention. Internal data warehouses should document whether they reproduce store-specific rules or apply independent active-user criteria.
Mathematical Mechanics of Horizontal Vertical and Diagonal Matrix Audits
Horizontal Axis (Row): Longitudinal User Lifecycle Decay (D0 ──> D1 ──> D2 ──> D3)
┌─────────────────────────────────────────────────────────────────────────┐
│ Cohort 2026-08-01 │ 100% │  42.4%  │  34.1%  │  28.0%  │  24.5%  │ ...  │
├───────────────────┼──────┼─────────┼─────────┼─────────┼─────────┼──────┤
│ Cohort 2026-08-02 │ 100% │  41.5%  │  33.0%  │  27.2%  │  23.8%  │ ...  │
├───────────────────┼──────┼─────────┼─────────┼─────────┼─────────┼──────┤
│ Cohort 2026-08-03 │ 100% │  44.0%  │  36.2%  │  30.1%  │  26.0%  │ ...  │
├───────────────────┼──────┼─────────┼─────────┼─────────┼─────────┼──────┤
│ Cohort 2026-08-04 │ 100% │  48.5%  │  40.1%  │  34.2%  │  29.5%  │ ...  │
└─────────────────────────────────────────────────────────────────────────┘
      ▲                           \
      │                            \ Diagonal Vector: Calendar Date Alignment
      │                             \ (e.g., Events occurring on 2026-08-04)
      Vertical Axis (Column): Cohort-over-Cohort Progression

A cohort matrix is a diagnostic localization tool, not a causal inference engine. Reading a matrix requires examining patterns across three spatial dimensions to form testable hypotheses:
Horizontal Analysis: Evaluating Longitudinal Retention Decay
Horizontal analysis evaluates a single cohort row from left to right across progressive elapsed days (
When auditing a row horizontally, data teams evaluate two core patterns:
- Initial Day 1 Transition (
): A steep initial drop warrants investigation, but its magnitude depends on the product’s natural usage frequency, cohort anchor definition, acquisition mix, technical error rates, and onboarding flow. - Long-Term Decay Moderation: Teams evaluate whether the decay slope moderates across successive intervals rather than assuming a cohort must plateau by an arbitrary day. Continued downward slope through Day 30 indicates continued decline in exact-day retention within the observation horizon, which should be interpreted relative to the product’s expected usage cadence.
Vertical Analysis: Auditing Cohort-over-Cohort Progression
Vertical analysis evaluates a single elapsed day column down through sequential cohort rows (e.g., comparing Day 7 retention across the August 1, August 2, August 3, and August 4 cohorts). Reading vertically answers the question: Are newer cohorts exhibiting different retention characteristics compared to earlier cohorts?
In the illustrative matrix above, inspecting the Day 1 column vertically reveals that cohorts acquired on or after August 4 exhibit higher retention (48.5%) than earlier cohorts (41.5%–44.0%).
However, vertical analysis alone does not establish that App Update v3.2 caused the improvement. Confounding variables—such as shifting marketing channel composition, regional rollout pacing, organic seasonal variance, or concurrent backend promotions—must be controlled before attributing performance shifts to a specific product release.
Diagonal Analysis: Isolating Shared Calendar-Day Anomalies
Diagonal analysis evaluates cells that share the exact same physical calendar date (
In a daily cohort grid with equally spaced rows and columns, cells sharing the same calendar date align along diagonal vectors. In sparse reporting matrices (such as grids displaying only
A synchronized drop across multiple cohorts on the same calendar date suggests a shared temporal factor affecting multiple cohorts rather than an isolated cohort-level failure.
Potential calendar-day causes include:
- Telemetry and Ingestion Outages: Missing client events, SDK endpoint downtime, logging partition errors, or schema validation failures that cause telemetry loss across all cohorts on date
. - Infrastructure and Service Outages: API gateway downtime, database latency, or third-party authentication failures that prevent active session execution.
- External Macro Events: Public holidays, regional connectivity disruptions, or major real-world events that alter typical mobile engagement patterns.
How Does Attribution Segmentation Reveal Channel Specific Retention Quality
Breaking Down Blended Matrices: Deconstructing Overall Retention by Acquisition Parameters
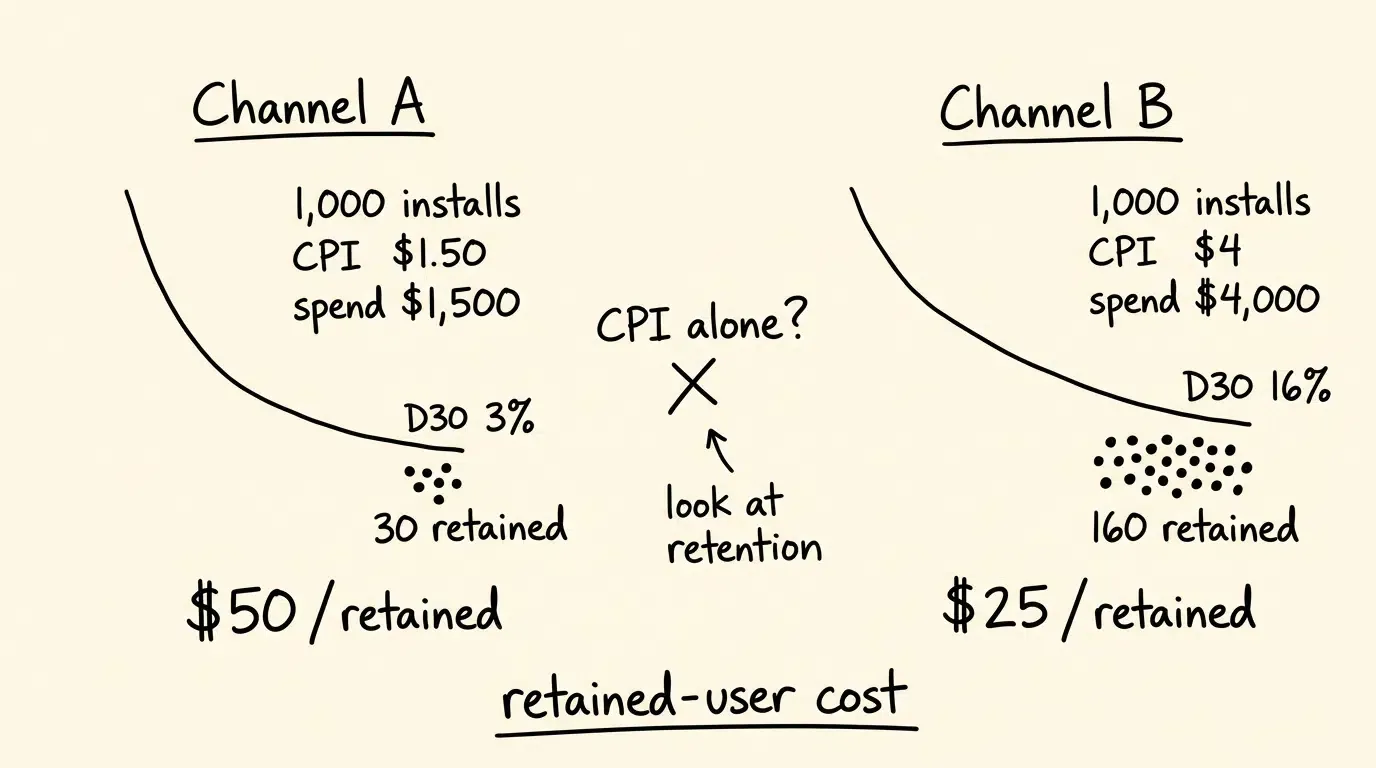
An aggregate cohort matrix presents a blended average of all incoming traffic. However, applications rarely acquire users from a single homogeneous source. A blended Day 30 retention rate of 12% can conceal underlying divergence between organic search, referral programs, paid search, and programmatic display cohorts.
Deconstructing blended matrices into segmented cohort grids based on pre-install attribution metadata is essential for accurate capital allocation. By isolating acquisition channels, growth teams can compare which campaigns are associated with stronger or weaker observed downstream retention.
Joining Campaign Metadata with In-App Session Streams
Constructing segmented cohort matrices requires a unified data pipeline that binds pre-install marketing parameters to downstream session telemetry.
OpoInstall, a mobile attribution and deep linking platform, captures contextual acquisition tokens (including campaign IDs, channel codes, and dynamic referral parameters) during initial web-to-app routing. Upon application activation, these metadata parameters are programmatically bound to the native client instance.
Downstream analytics engines join these attribution parameters with post-activation lifecycle events, enabling automated SQL pipelines to generate separate, dimensional cohort grids for every marketing channel, creative variant, and partner source.
Empirical Evaluation: Comparing Acquisition Cohort Retention
Referral, search, display, affiliate, and organic cohorts can exhibit materially different retention patterns, but no acquisition source has a universal retention advantage. Product teams must compare segmented matrices empirically while controlling for target audience, ad creative alignment, geography, campaign objective, and onboarding paths.
Segmenting matrices by acquisition channel enables growth teams to measure channel-specific retention curves and calculate downstream capital efficiency. The effective Cost Per Retained User at Day 30 (
Where
Architecting Raw Data Ingestion Pipelines for Automated Cohort Generation
Logging Client-Side Active Sessions with Explicit Active-State Criteria
Automated cohort matrix generation requires resilient client-side event logging integrated with native operating system lifecycles. Analytics SDKs instrument native lifecycle hooks (Application.ActivityLifecycleCallbacks on Android, UIWindowSceneDelegate callbacks on iOS) to capture foreground transitions, logging timestamps, session sequence indexes, and duration metrics.
Telemetry pipelines enforce explicit active criteria (e.g., verifying that a session remained in the foreground for an illustrative product-defined threshold of
Ingesting Structured Telemetry Payloads via Low-Latency Event Streaming
Client applications transmit structured JSON telemetry payloads to real-time ingestion brokers. Retention-relevant event payloads should include the pseudonymous instance identifiers, session sequence numbers, UTC timestamps, and contextual attribution metadata required by the downstream data warehouse schema.
Developers can consult the cohort raw data export documentation for technical specifications regarding data schema definitions and webhook streaming configurations.
Automating Daily SQL Aggregation Jobs to Construct Dynamic Warehouse Cohort Grids
Once raw session events and attribution records are ingested into an enterprise data warehouse, scheduled SQL transformation jobs execute daily rolling aggregations to compute cohort retention matrices.
Engineering teams should choose a unified reporting timezone (such as UTC or business operating time) and define an explicit data completeness watermark (such as the latest fully completed UTC day, DATE_SUB(CURRENT_DATE('UTC'), INTERVAL 1 DAY)) before calculating elapsed day boundaries. Evaluating maturity against a completed data watermark prevents partial-day distortion on the most recent active milestone, while IS NOT DISTINCT FROM ensures nullable attribution dimensions (such as organic traffic with no campaign ID) are preserved accurately in dimensional joins.
The SQL implementation below demonstrates a query that extracts authoritative cohort anchors, preserves zero-activity cohorts via left joins, enforces date maturity checks, and outputs a dimensional cohort retention matrix:
```sql
-- GoogleSQL / BigQuery Example: 30-Day Cohort Retention Matrix Generation
WITH data_watermark AS (
    -- Step 1: Establish latest fully completed reporting date to prevent partial-day censoring
    SELECT DATE_SUB(CURRENT_DATE('UTC'), INTERVAL 1 DAY) AS data_complete_through_date
),

ranked_anchors AS (
    -- Step 2: Extract earliest authoritative anchor event per entity with deterministic tie-breaker
    SELECT
        user_id,
        event_timestamp,
        event_id,
        channel_code,
        campaign_id,
        ROW_NUMBER() OVER(
            PARTITION BY user_id
            ORDER BY event_timestamp ASC, event_id ASC
        ) AS anchor_rank
    FROM app_events.telemetry_stream
    WHERE event_name = 'onboarding_complete' -- Defined cohort anchor event
),

cohort_anchor AS (
    -- Step 3: Establish single immutable anchor date and attribution snapshot
    SELECT
        user_id,
        DATE(event_timestamp, 'UTC') AS cohort_date,
        channel_code,
        campaign_id
    FROM ranked_anchors
    WHERE anchor_rank = 1
),

cohort_sizes AS (
    -- Step 4: Compute baseline cohort size (|U_i|) per date and dimension
    SELECT
        cohort_date,
        channel_code,
        campaign_id,
        COUNT(DISTINCT user_id) AS cohort_size
    FROM cohort_anchor
    GROUP BY cohort_date, channel_code, campaign_id
),

activity_stream AS (
    -- Step 5: Extract qualifying active sessions post-anchor
    SELECT DISTINCT
        user_id,
        DATE(event_timestamp, 'UTC') AS activity_date
    FROM app_events.telemetry_stream
    WHERE is_qualifying_active_event = TRUE
      AND is_background_wake = FALSE
),

cohort_activity AS (
    -- Step 6: Join cohort anchors with subsequent daily activity
    SELECT
        c.cohort_date,
        c.channel_code,
        c.campaign_id,
        DATE_DIFF(a.activity_date, c.cohort_date, DAY) AS elapsed_days,
        COUNT(DISTINCT a.user_id) AS active_users
    FROM cohort_anchor c
    INNER JOIN activity_stream a
        ON c.user_id = a.user_id
        AND a.activity_date >= c.cohort_date
    WHERE DATE_DIFF(a.activity_date, c.cohort_date, DAY) BETWEEN 0 AND 30
    GROUP BY c.cohort_date, c.channel_code, c.campaign_id, elapsed_days
)

-- Step 7: Pivot into dimensional cohort matrix with watermark-based right-censoring protection
SELECT
    cs.cohort_date,
    cs.channel_code,
    cs.campaign_id,
    cs.cohort_size,
    -- Day 1 Retention
    CASE
        WHEN DATE_DIFF(w.data_complete_through_date, cs.cohort_date, DAY) < 1 THEN NULL
        ELSE ROUND(SAFE_DIVIDE(COALESCE(MAX(CASE WHEN ca.elapsed_days = 1 THEN ca.active_users END), 0) * 100.0, cs.cohort_size), 2)
    END AS d1_retention_pct,
    -- Day 3 Retention
    CASE
        WHEN DATE_DIFF(w.data_complete_through_date, cs.cohort_date, DAY) < 3 THEN NULL
        ELSE ROUND(SAFE_DIVIDE(COALESCE(MAX(CASE WHEN ca.elapsed_days = 3 THEN ca.active_users END), 0) * 100.0, cs.cohort_size), 2)
    END AS d3_retention_pct,
    -- Day 7 Retention
    CASE
        WHEN DATE_DIFF(w.data_complete_through_date, cs.cohort_date, DAY) < 7 THEN NULL
        ELSE ROUND(SAFE_DIVIDE(COALESCE(MAX(CASE WHEN ca.elapsed_days = 7 THEN ca.active_users END), 0) * 100.0, cs.cohort_size), 2)
    END AS d7_retention_pct,
    -- Day 14 Retention
    CASE
        WHEN DATE_DIFF(w.data_complete_through_date, cs.cohort_date, DAY) < 14 THEN NULL
        ELSE ROUND(SAFE_DIVIDE(COALESCE(MAX(CASE WHEN ca.elapsed_days = 14 THEN ca.active_users END), 0) * 100.0, cs.cohort_size), 2)
    END AS d14_retention_pct,
    -- Day 30 Retention
    CASE
        WHEN DATE_DIFF(w.data_complete_through_date, cs.cohort_date, DAY) < 30 THEN NULL
        ELSE ROUND(SAFE_DIVIDE(COALESCE(MAX(CASE WHEN ca.elapsed_days = 30 THEN ca.active_users END), 0) * 100.0, cs.cohort_size), 2)
    END AS d30_retention_pct
FROM cohort_sizes cs
CROSS JOIN data_watermark w
LEFT JOIN cohort_activity ca
    ON cs.cohort_date = ca.cohort_date
    AND cs.channel_code IS NOT DISTINCT FROM ca.channel_code
    AND cs.campaign_id IS NOT DISTINCT FROM ca.campaign_id
GROUP BY cs.cohort_date, cs.channel_code, cs.campaign_id, cs.cohort_size, w.data_complete_through_date
ORDER BY cs.cohort_date DESC, cs.channel_code ASC, cs.campaign_id ASC;
When Is Advanced Multi Dimensional Cohort Analysis Necessary for Growth Teams
Suitable Conditions for Dedicated Cohort Analysis Frameworks
Implementing multi-dimensional cohort analysis and automated matrix pipelines provides significant operational ROI under specific conditions:
- Multi-Channel Marketing Deployments: Growth operations managing diverse paid ad networks, influencer partnerships, referral programs, and organic web-to-app channels that require channel-level retention auditing.
- Subscription and SaaS Business Models: Applications where unit economics and customer lifetime value depend on sustained retention across multi-month renewal cycles.
- High-Velocity Product Release Cycles: Engineering teams deploying frequent client updates that require vertical cohort auditing to detect performance shifts across versions.
- Feature-Level Adoption Tracking: Products with complex functional ecosystems where behavioral cohort segmentation is needed to identify which specific features drive long-term habituation.
Unsuitable Conditions for Complex Cohort Deployments
Deploying dedicated cohort analytics infrastructure may introduce unnecessary overhead in the following scenarios:
- Single-Session Utility Applications: Basic tools (such as file format converters, QR scanners, or offline calculators) where repeat engagement is neither expected nor central to the monetization strategy.
- Early Prototype Explorations: Pre-product-market-fit applications focused solely on validating core technical feasibility before acquiring sufficient sample sizes for statistical cohort analysis.
- Monolithic Single-Source Channels: Small-scale applications relying exclusively on unassisted organic app store discovery without external marketing or deep-linking infrastructure.
Common Misconceptions in Cohort Analysis Strategy
- Misconception: Day 1 Retention Gains Guarantee Long-Term Cohort Survival: While improving Day 1 retention reflects onboarding UX enhancements, it does not ensure Day 30 retention. If horizontal decay remains steep, initial gains will dissipate unless mid-funnel habituation is addressed.
- Misconception: Cohort Matrix Cells Represent Permanent Static Populations: In classic N-Day cohort tables, active user sets fluctuate daily. A stable percentage across horizontal cells indicates aggregate rate stability, not that the exact same individuals logged sessions every consecutive day.
Frequently Asked Questions (FAQ)
What does a sudden drop along a diagonal line in a cohort table indicate?
How does horizontal cohort analysis differ from vertical cohort analysis?
Why should cohort retention matrices be segmented by acquisition channel?
Summary and Decision Framework
Auditing mobile app lifecycle health requires moving beyond high-level active user metrics to structured cohort analysis. Evaluating cohort grids across horizontal, vertical, and diagonal axes provides the granular visibility needed to distinguish patterns consistent with lifecycle decay from patterns associated with version changes or shared calendar-time anomalies.
Building an effective cohort analysis architecture depends on defining explicit active-state criteria, establishing clear cohort anchor events, and joining pre-install acquisition parameters with post-activation event streams. By pairing client telemetry with independent attribution metadata, product and data engineering teams can diagnose retention bottlenecks accurately and optimize marketing capital allocation.
To evaluate how unified attribution and raw event data infrastructure can support your cohort retention auditing, explore the mobile attribution implementation reference.
Related Materials
-
Concepts: Cohort Matrix Grid, Three-Axis Audit, Horizontal Lifecycle Decay, Vertical Progression, Diagonal Event Alignment
-
Technologies: Mobile App Analytics, Event Stream Ingestion, Data Warehouse SQL Aggregation, Raw Attribution Streaming
-
APIs & Data Interfaces: OpoInstall raw attribution export and S2S webhook interfaces, Android
Application.ActivityLifecycleCallbacks, iOSUIWindowSceneDelegate -
Official Documentation & References:
Share this article