How does event streaming reduce S2S postback delays? Event streaming reduces mobile attribution delays by replacing scheduled batch processing with continuous event pipelines, allowing MMP platforms to process conversion events and deliver S2S postbacks faster.
Real-time reporting describes the ability to process, analyze, and display conversion events shortly after they occur. Event streaming supports this capability by moving event data through continuous processing pipelines instead of scheduled ETL batches, reducing end-to-end latency across event ingestion, attribution processing, and S2S postback delivery.
| Term | Definition | Related Concept |
|---|---|---|
| Real-Time Reporting | The ability to process, analyze, and display conversion events shortly after they occur. | Event Streaming |
| Raw Data | Unprocessed event-level records containing timestamps, identifiers, and conversion attributes before aggregation. | Event Ingestion |
| Conversion Tracking | The process of recording conversion events and sending attribution signals to downstream systems. | S2S Postback |
| S2S Postback | A server-to-server webhook request that sends conversion data from an attribution platform to an advertising platform. | Mobile Attribution |
Short Answer
Event streaming removes scheduled batch delays from conversion processing. Instead of queuing conversion records for periodic batch updates, streaming pipelines forward attribution events continuously to downstream S2S postback systems.
At a Glance
| Performance Challenge | Root Cause | Event-Driven Solution |
|---|---|---|
| Delayed S2S Postbacks | Legacy batch processing queues | Event-driven stream ingestion |
| DSP Bidding Inefficiencies | Stale conversion signal feedback | Low-latency event processing |
| Dashboard Discrepancies | Delayed webhook delivery | Continuous event pipelines |
Why S2S Postback Latency Happens in Mobile Attribution
The Bottleneck of Legacy ETL Batch Pipelines
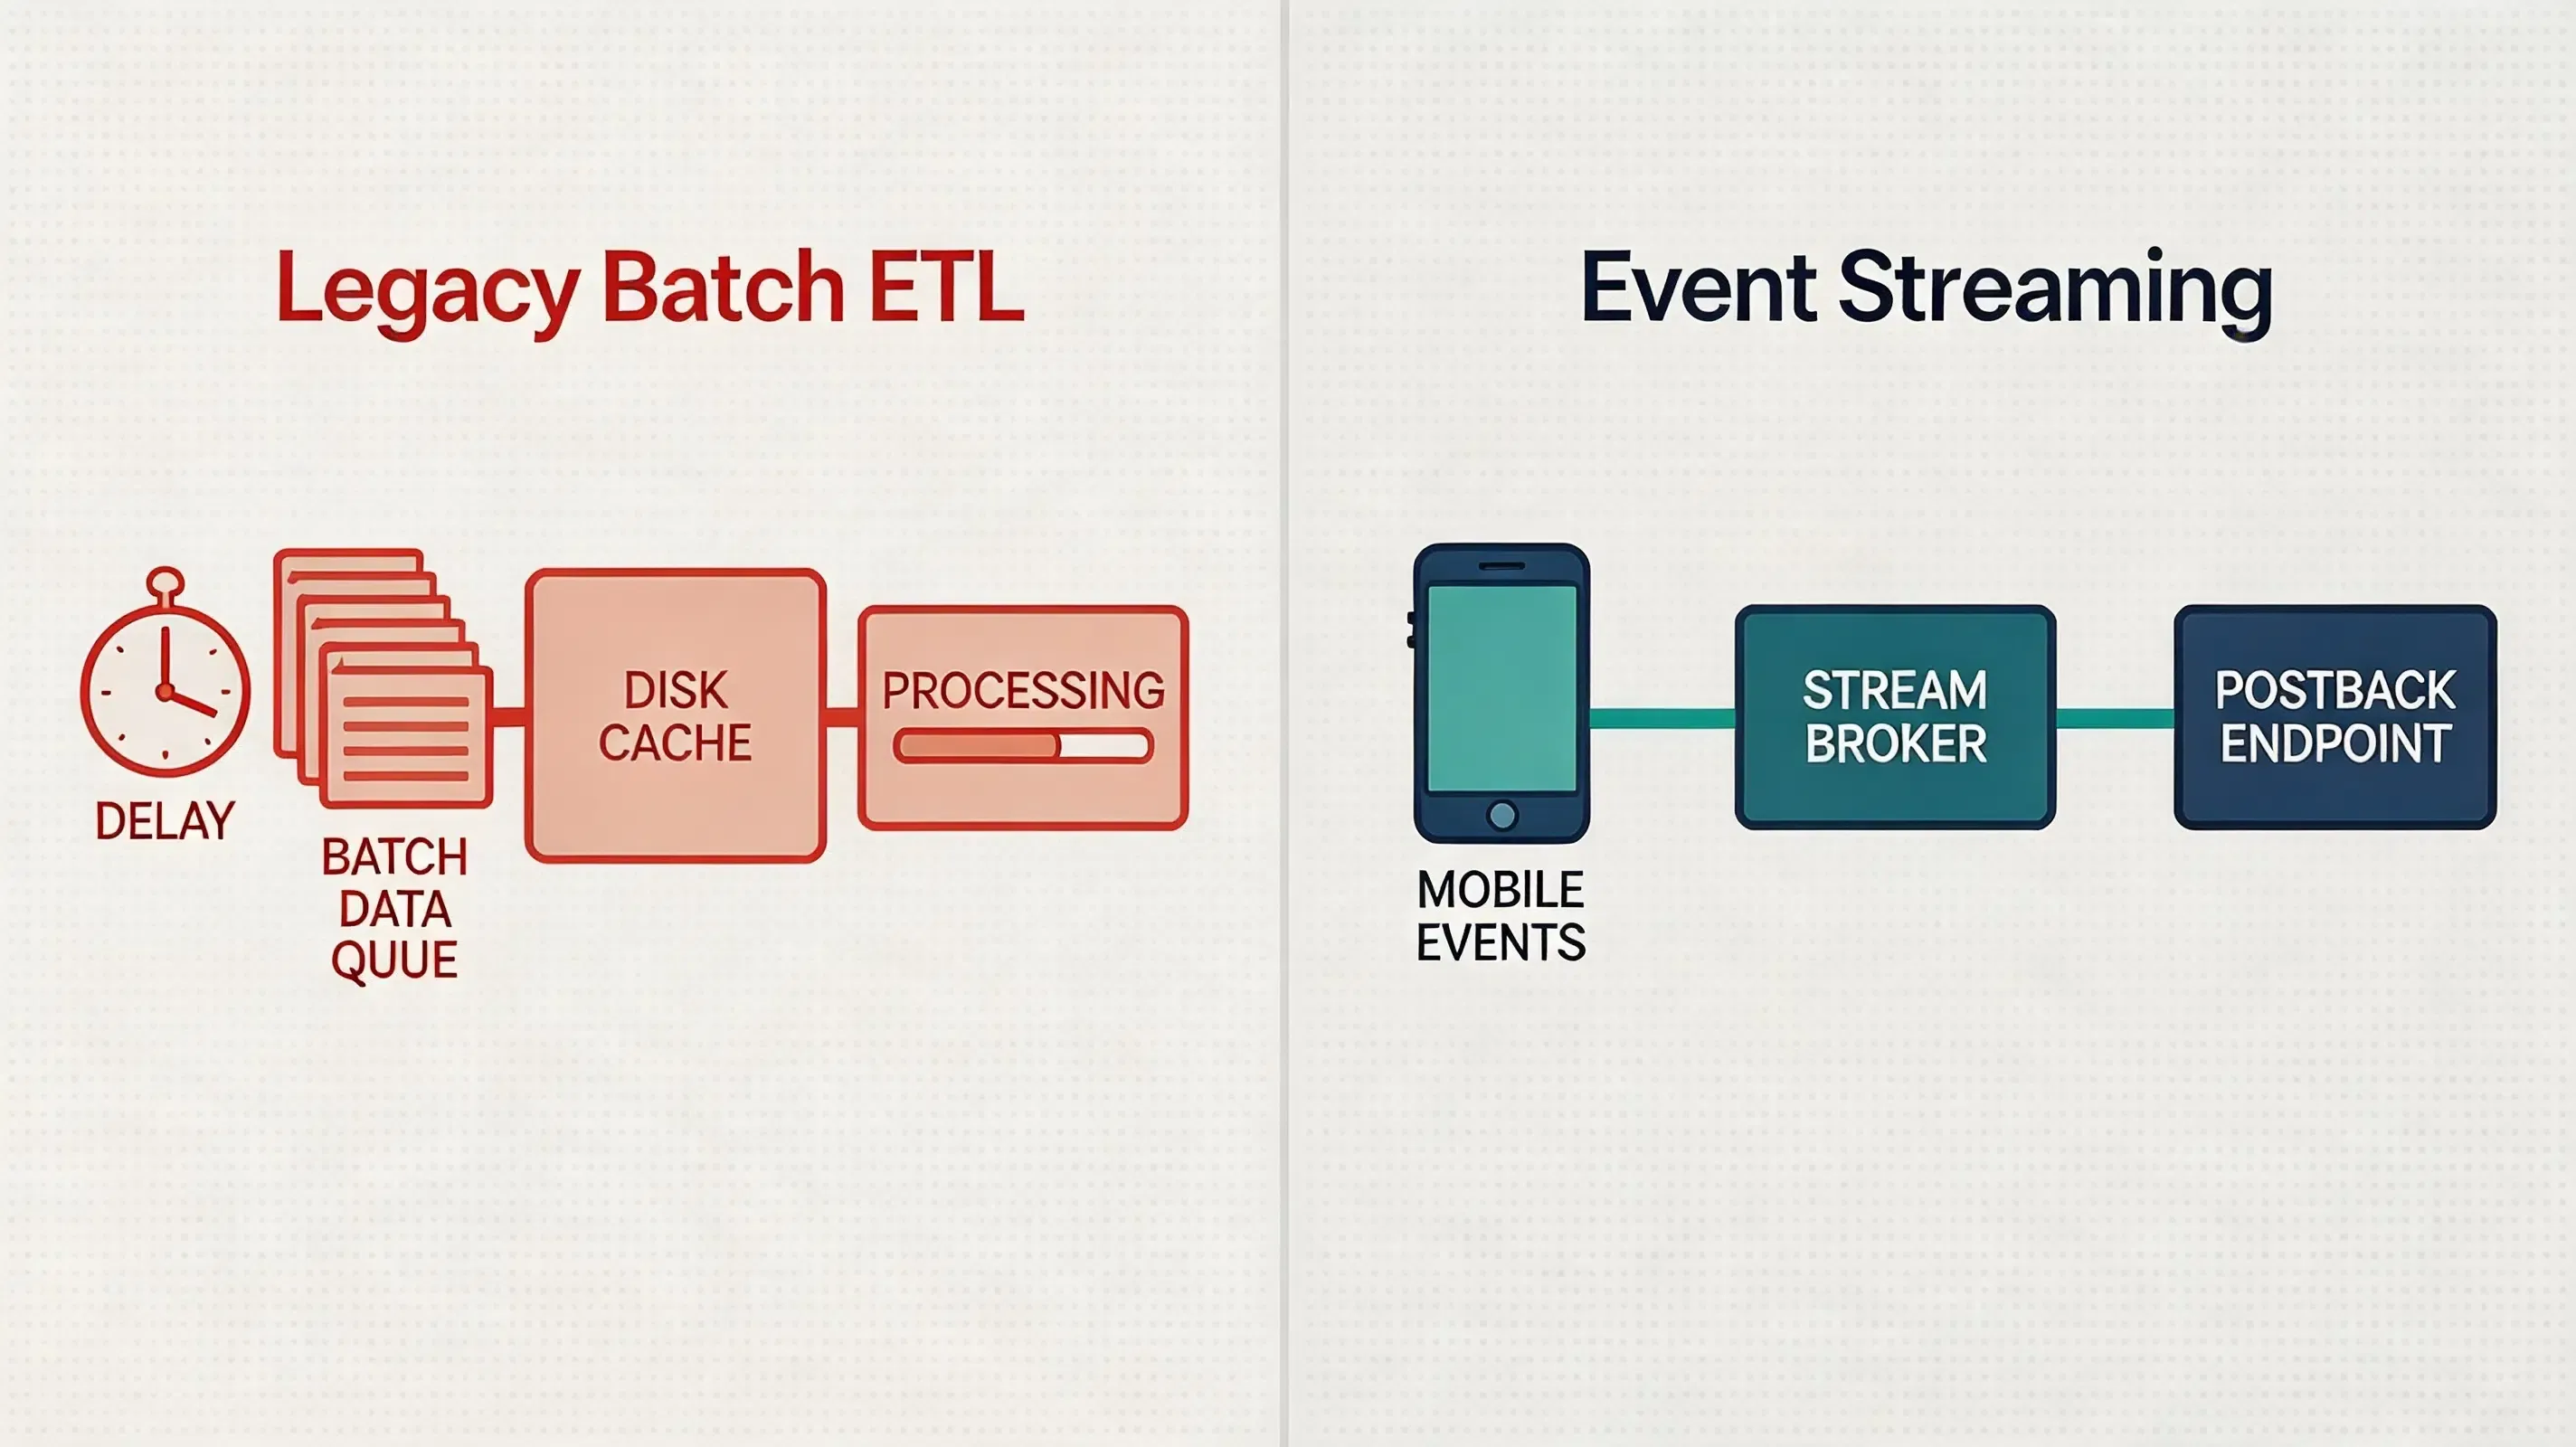
Some legacy mobile measurement workflows relied on Extract, Transform, Load (ETL) batch-processing patterns for delayed analytics updates. Incoming event telemetry—such as ad clicks, app installations, and post-install purchase events—is written to temporary staging tables or disk buffers. At scheduled intervals, queued records are processed through scheduled batch jobs.
While batch architectures simplify database indexing and reduce continuous write operations on relational databases, they introduce a structural latency gap. An app installation occurring during an active campaign might not be transformed and written to reporting tables until the scheduled batch cycle completes. Consequently, downstream workflows that rely on analytical database triggers inherit processing delays before an S2S postback can be generated in server-to-server attribution workflows.
Network Latency vs Processing Queue Delays
To effectively troubleshoot postback latency, performance teams must distinguish between network transmission delays and processing queue delays:
-
Network Transmission Latency: The time required for an event payload to travel across public internet routes from a mobile device to the edge server. Network latency varies depending on device connectivity, geographic distance, and carrier conditions.
-
Processing Queue Latency: The time an event spends waiting inside server-side staging queues before an attribution engine processes the record and fires an outbound S2S postback. Processing queue delays are a common contributor to severe postback lags in batch-oriented architectures.
Understanding this distinction allows engineering teams to focus on server-side queue reduction rather than misdiagnosing network hops. Event streaming primarily addresses processing and queue delays; it does not eliminate latency introduced by privacy frameworks, network-side processing windows, client connectivity, or delayed responses from receiving ad network APIs.
The Financial Cost of Delayed Conversion Postbacks
In programmatic media buying, postback latency can affect ad spend efficiency by delaying conversion feedback used by automated bidding systems. Demand-Side Platforms (DSPs) and self-attributing ad networks utilize automated machine learning models (such as target CPA or target ROAS) to evaluate bid requests. These bidding engines require rapid conversion signals to train predictive models, adjust impression prices, and suppress non-converting user segments.
When conversion signals are delayed, DSP bidding algorithms operate on stale conversion data. This can delay bid adjustments, audience exclusions, or campaign-level optimization decisions, potentially increasing spend on traffic that would otherwise have been deprioritized. Automated bidders continue purchasing impressions at high bid prices for campaigns or ad creatives that may already have exceeded target CPA thresholds.
Dashboard Discrepancies Caused by Postback Caching
Postback latency also introduces persistent discrepancies between Mobile Measurement Partner (MMP) reporting dashboards and ad network reporting consoles. When an MMP delays firing S2S conversion webhooks due to internal batch queues, receiving ad networks may process, delay, or reject late-arriving events according to their respective attribution and reporting windows.
Furthermore, ad networks calculate campaign metrics based on the timestamp when the postback webhook is received or logged in their systems. When postbacks arrive in delayed bursts rather than smooth streams, delayed postback delivery can create discrepancies between CPI calculations reported by advertisers, MMP dashboards, and advertising platforms. Mobile measurement platforms can reduce these delays by adopting event-driven ingestion architectures.
How Event Streaming Architecture Reduces Postback Latency
Transitioning from Micro-Batching to Event-Driven Stream Ingestion
Overcoming postback delays requires replacing scheduled ETL batch jobs with an event-driven stream processing architecture. Instead of accumulating events in relational disk tables, stream architectures process each user interaction as an individual, continuous data message.
In an event streaming framework, incoming HTTP requests from mobile SDKs or web trackers are first received by ingestion services and then published to a distributed event streaming platform. Processing workers consume these message logs continuously, executing validation, event enrichment, and downstream attribution processing without waiting for scheduled batch intervals.
Decoupling Event Collection from Client-Side UI Thread Rendering
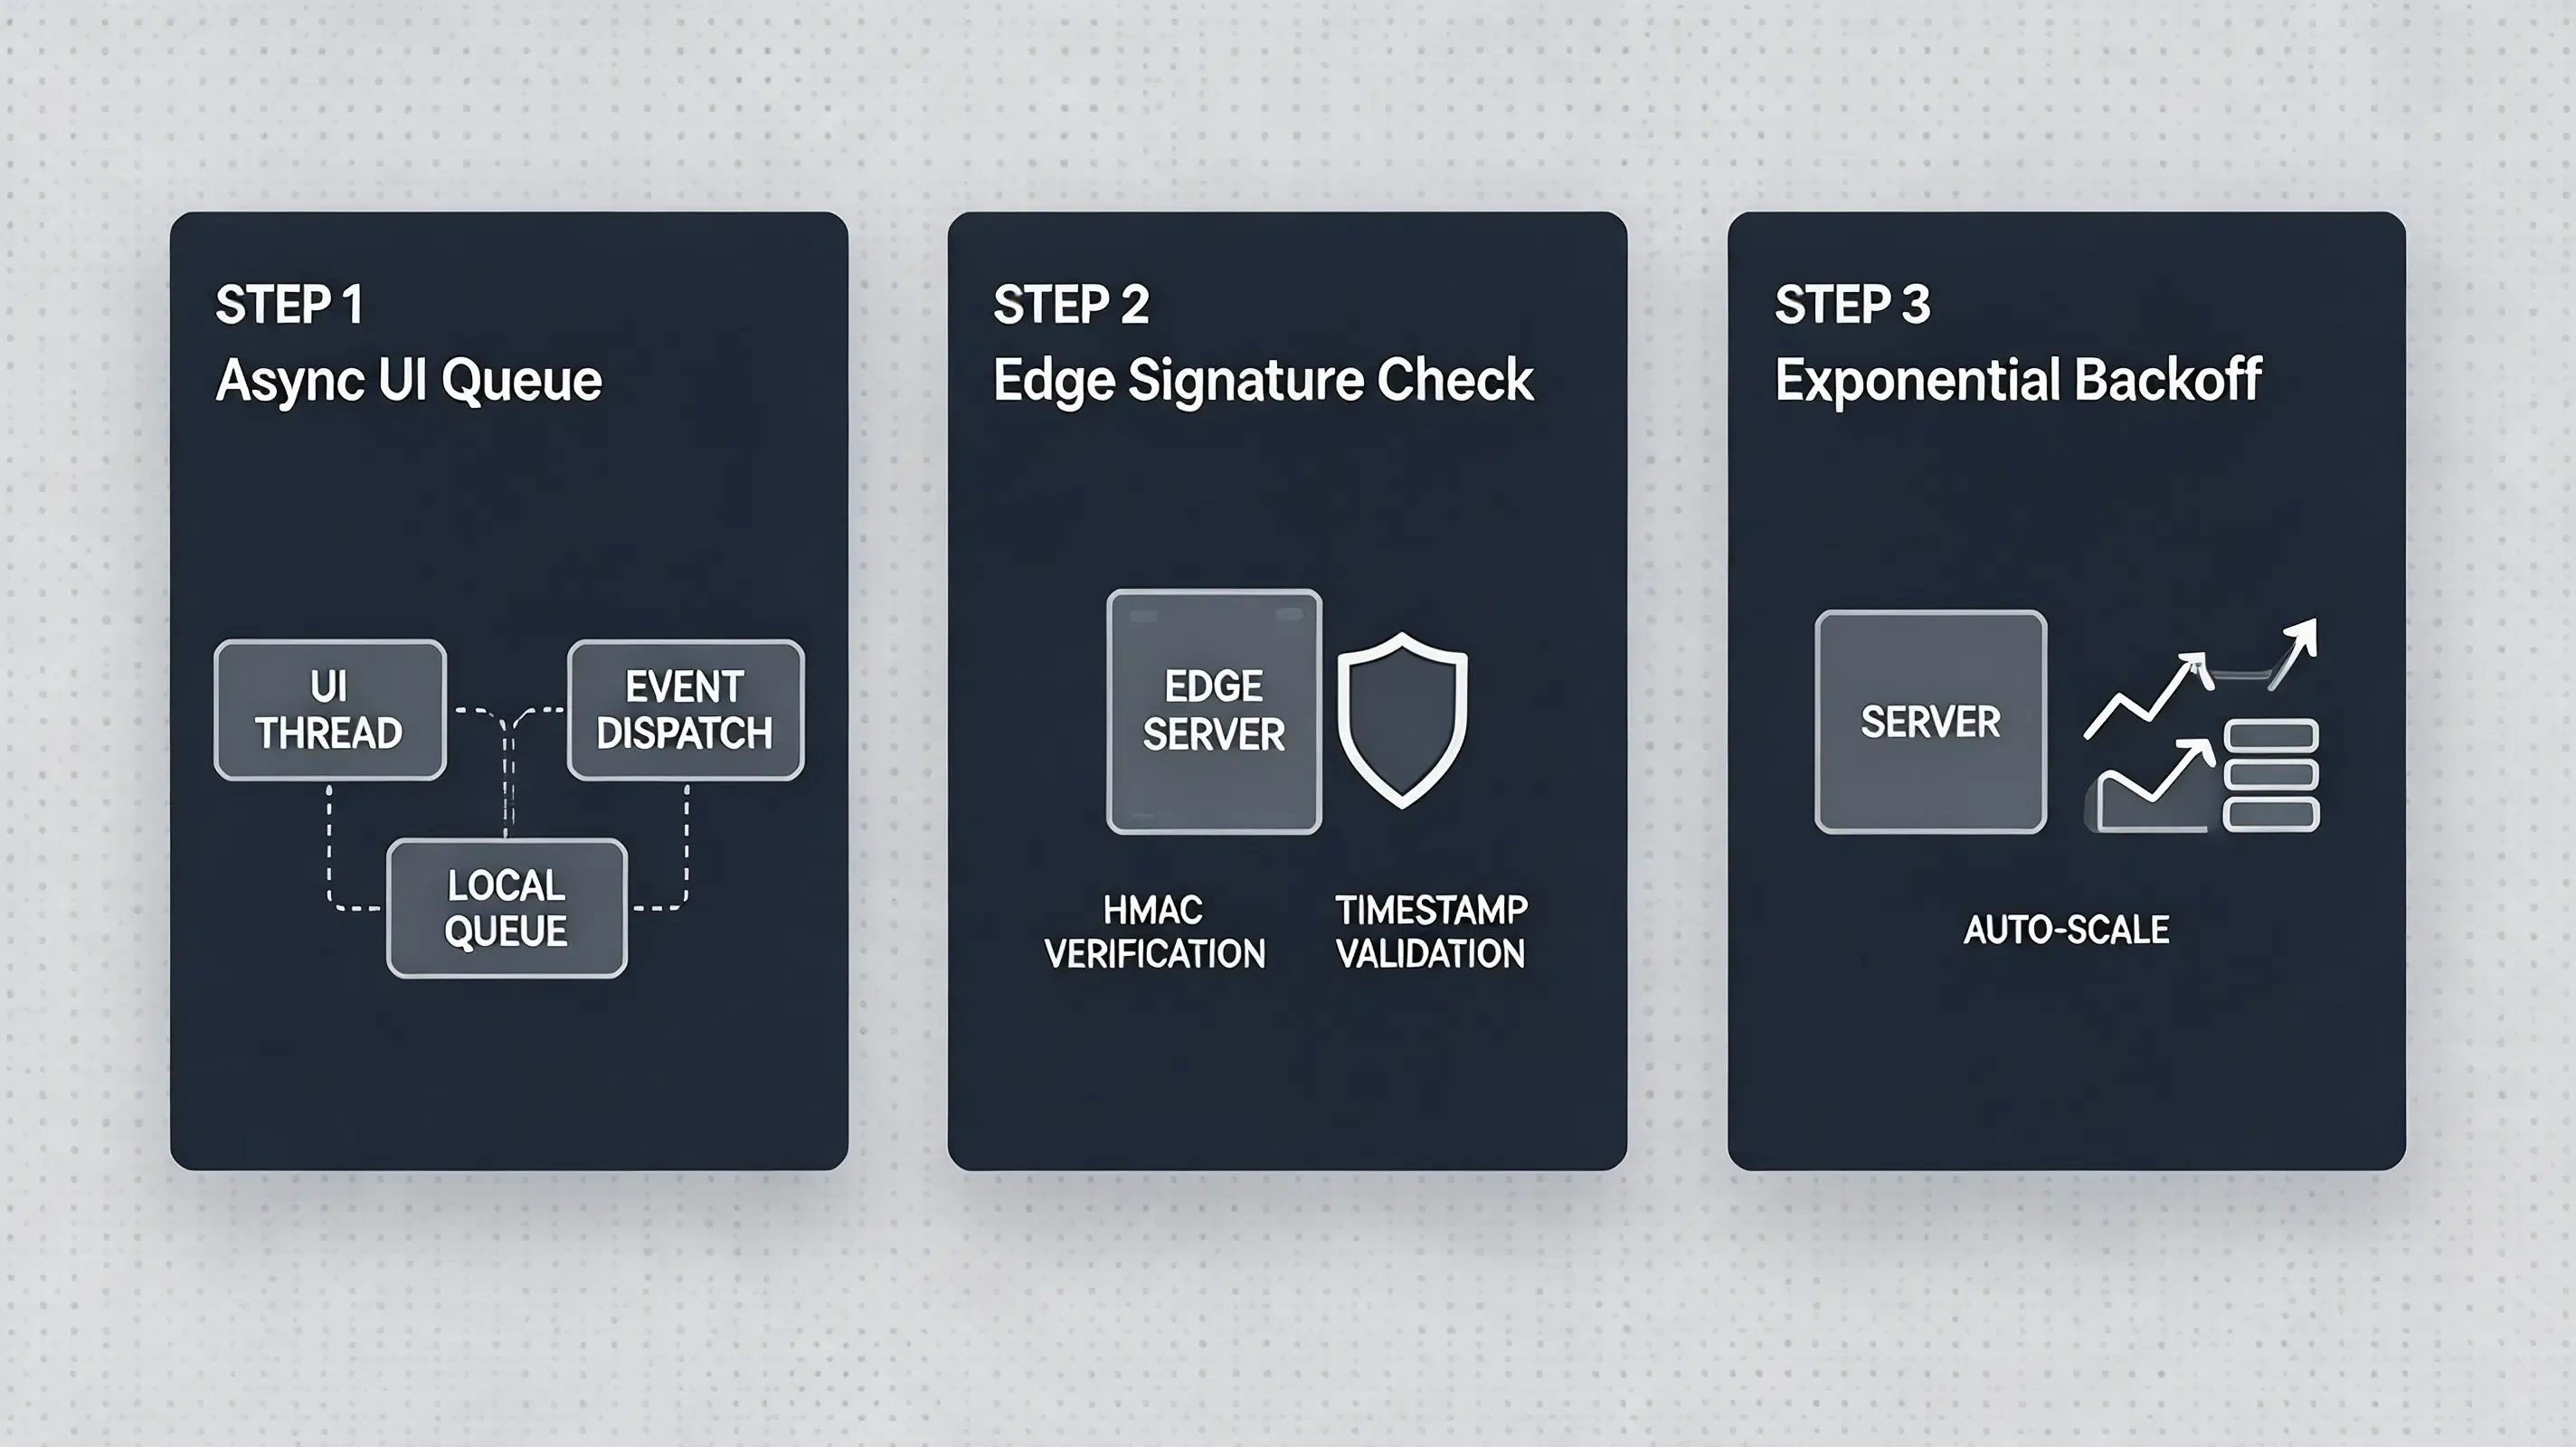
To maintain low latency without impairing mobile app performance, client-side event collection is decoupled from UI rendering threads. When a user completes an in-app event (e.g., completing a purchase or registration), the mobile SDK writes the event payload to an encrypted local queue and returns control to the main UI thread instantly.
A background network worker processes the local queue, transmitting HTTP POST requests asynchronously to edge ingestion nodes. This ensures that application performance remains fluid while event telemetry enters the ingestion pipeline rapidly.
Edge Validation: Filtering Request Telemetry Before Downstream Processing
High-scale attribution platforms may deploy regional ingestion endpoints or edge processing layers to reduce network latency and perform early validation. When an ingestion node receives an event payload, it executes immediate edge validation tasks:
-
Timestamp Verification: Records an ingestion timestamp when the HTTP request is received while preserving the original event timestamp.
-
Signature Authentication: Validates dynamic HMAC-SHA256 request signatures to verify payload authenticity prior to broker entry.
-
Schema Parsing: Extracts essential routing keys for immediate stream partitioning.
By executing validation at the edge, invalid requests can be filtered before downstream processing, while verified payloads flow into real-time processing pipes without queuing delay.
Architectural Differences Between Batch Analytics and Real-Time Reporting
Comparative Ingestion and Dispatch Mechanics Across Analytics Models
Understanding the architectural differences between batch processing, micro-batching, and real-time stream ingestion illustrates why legacy setups introduce postback caching issues.
The table below contrasts key technical metrics across different processing models:
| Feature Metric | Legacy Batch Analytics | Micro-Batch Processing | Event Streaming Architecture |
|---|---|---|---|
| Data Ingestion Delay | Minutes to hours | Seconds to minutes | Near real-time |
| Processing Architecture | Scheduled ETL jobs | Micro-chunk queues | Event-driven stream broker |
| Postback Execution | Scheduled batch API calls | Delayed queue pushes | Low-latency S2S webhook dispatch |
| Ad Bidding Feedback | Stale signal feedback | Slightly delayed signals | Rapid CPA/ROAS optimization feedback |
| Database Write Pattern | Relational disk writes | Hybrid staging tables | Streaming database writes and analytical storage |
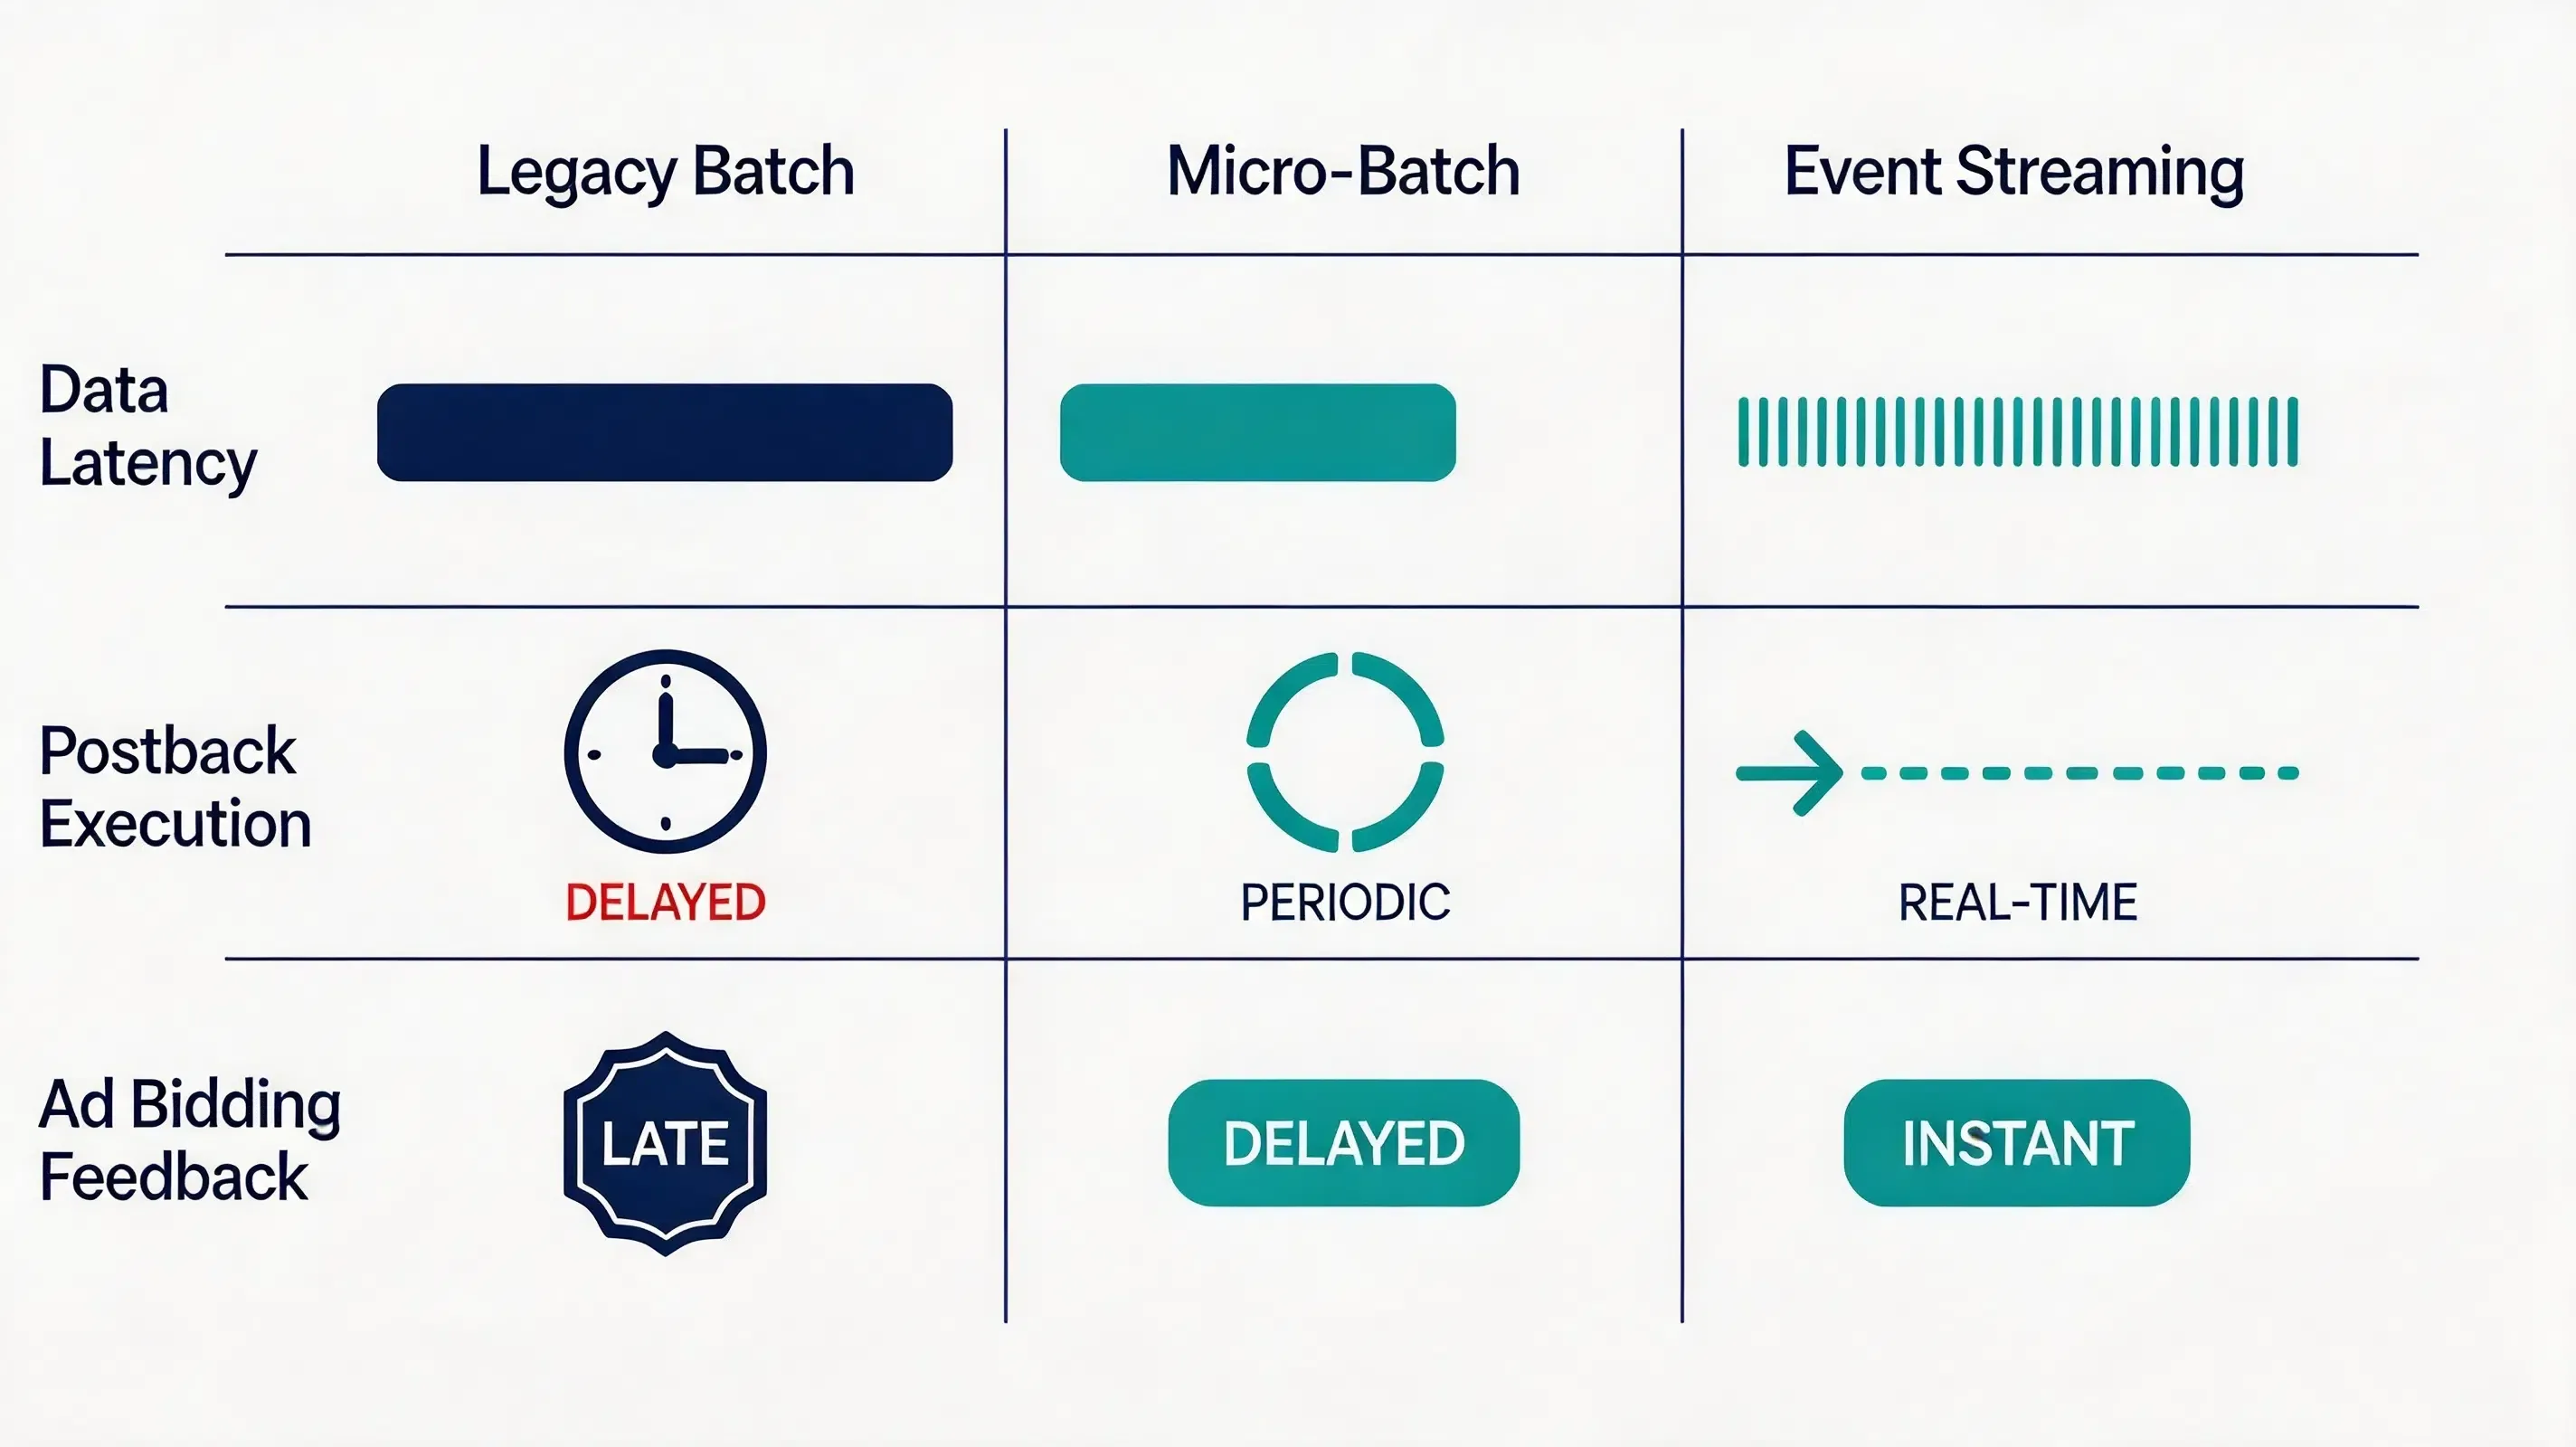
Comparing Data Latency, Infrastructure Requirements, and Postback Triggers
While batch architectures require simpler relational database setups, real-time reporting architectures demand high-concurrency event brokers and specialized analytical databases designed for high-volume concurrent writes.
In an event streaming framework, postback dispatchers consume attribution results from event processing pipelines and trigger S2S webhook delivery without waiting for scheduled analytical database updates. Once an install or conversion event is attributed and passes the required processing checks, the postback module formats the destination network payload and dispatches an HTTP POST request without waiting for a scheduled reporting batch.
Engineers seeking to implement low-latency event pipelines can consult the OpoInstall attribution SDK integration resources to configure client-side SDK logging and real-time event dispatchers.
How Low-Latency S2S Postbacks Improve Conversion Tracking Efficiency
Accelerating Ad Network Machine Learning Models
Programmatic Demand-Side Platforms (DSPs) use machine learning algorithms to evaluate thousands of bid requests per second. When a new ad campaign launches, these bidding algorithms undergo a learning phase where they explore impression inventory to identify high-converting user segments.
Rapid conversion feedback accelerates this learning phase. When an MMP fires S2S postbacks shortly after conversion, DSP algorithms receive timely conversion signals. The bidding engine quickly identifies which publisher placements, device types, and geographic regions yield conversions, enabling the DSP to adjust bid pricing efficiently.
Frequency Capping and Audience Exclusion Triggers
In addition to accelerating cold starts, low-latency postbacks inform real-time budget pacing and frequency capping. If a retargeting campaign is configured to stop serving ads to a user once they complete an in-app purchase, delayed postbacks cause the DSP to continue serving retargeting ads to that user for a period post-purchase.
Delivering S2S conversion postbacks rapidly allows DSPs to update frequency caps and exclude converted users promptly, suppressing wasteful ad impressions and protecting ad spend.
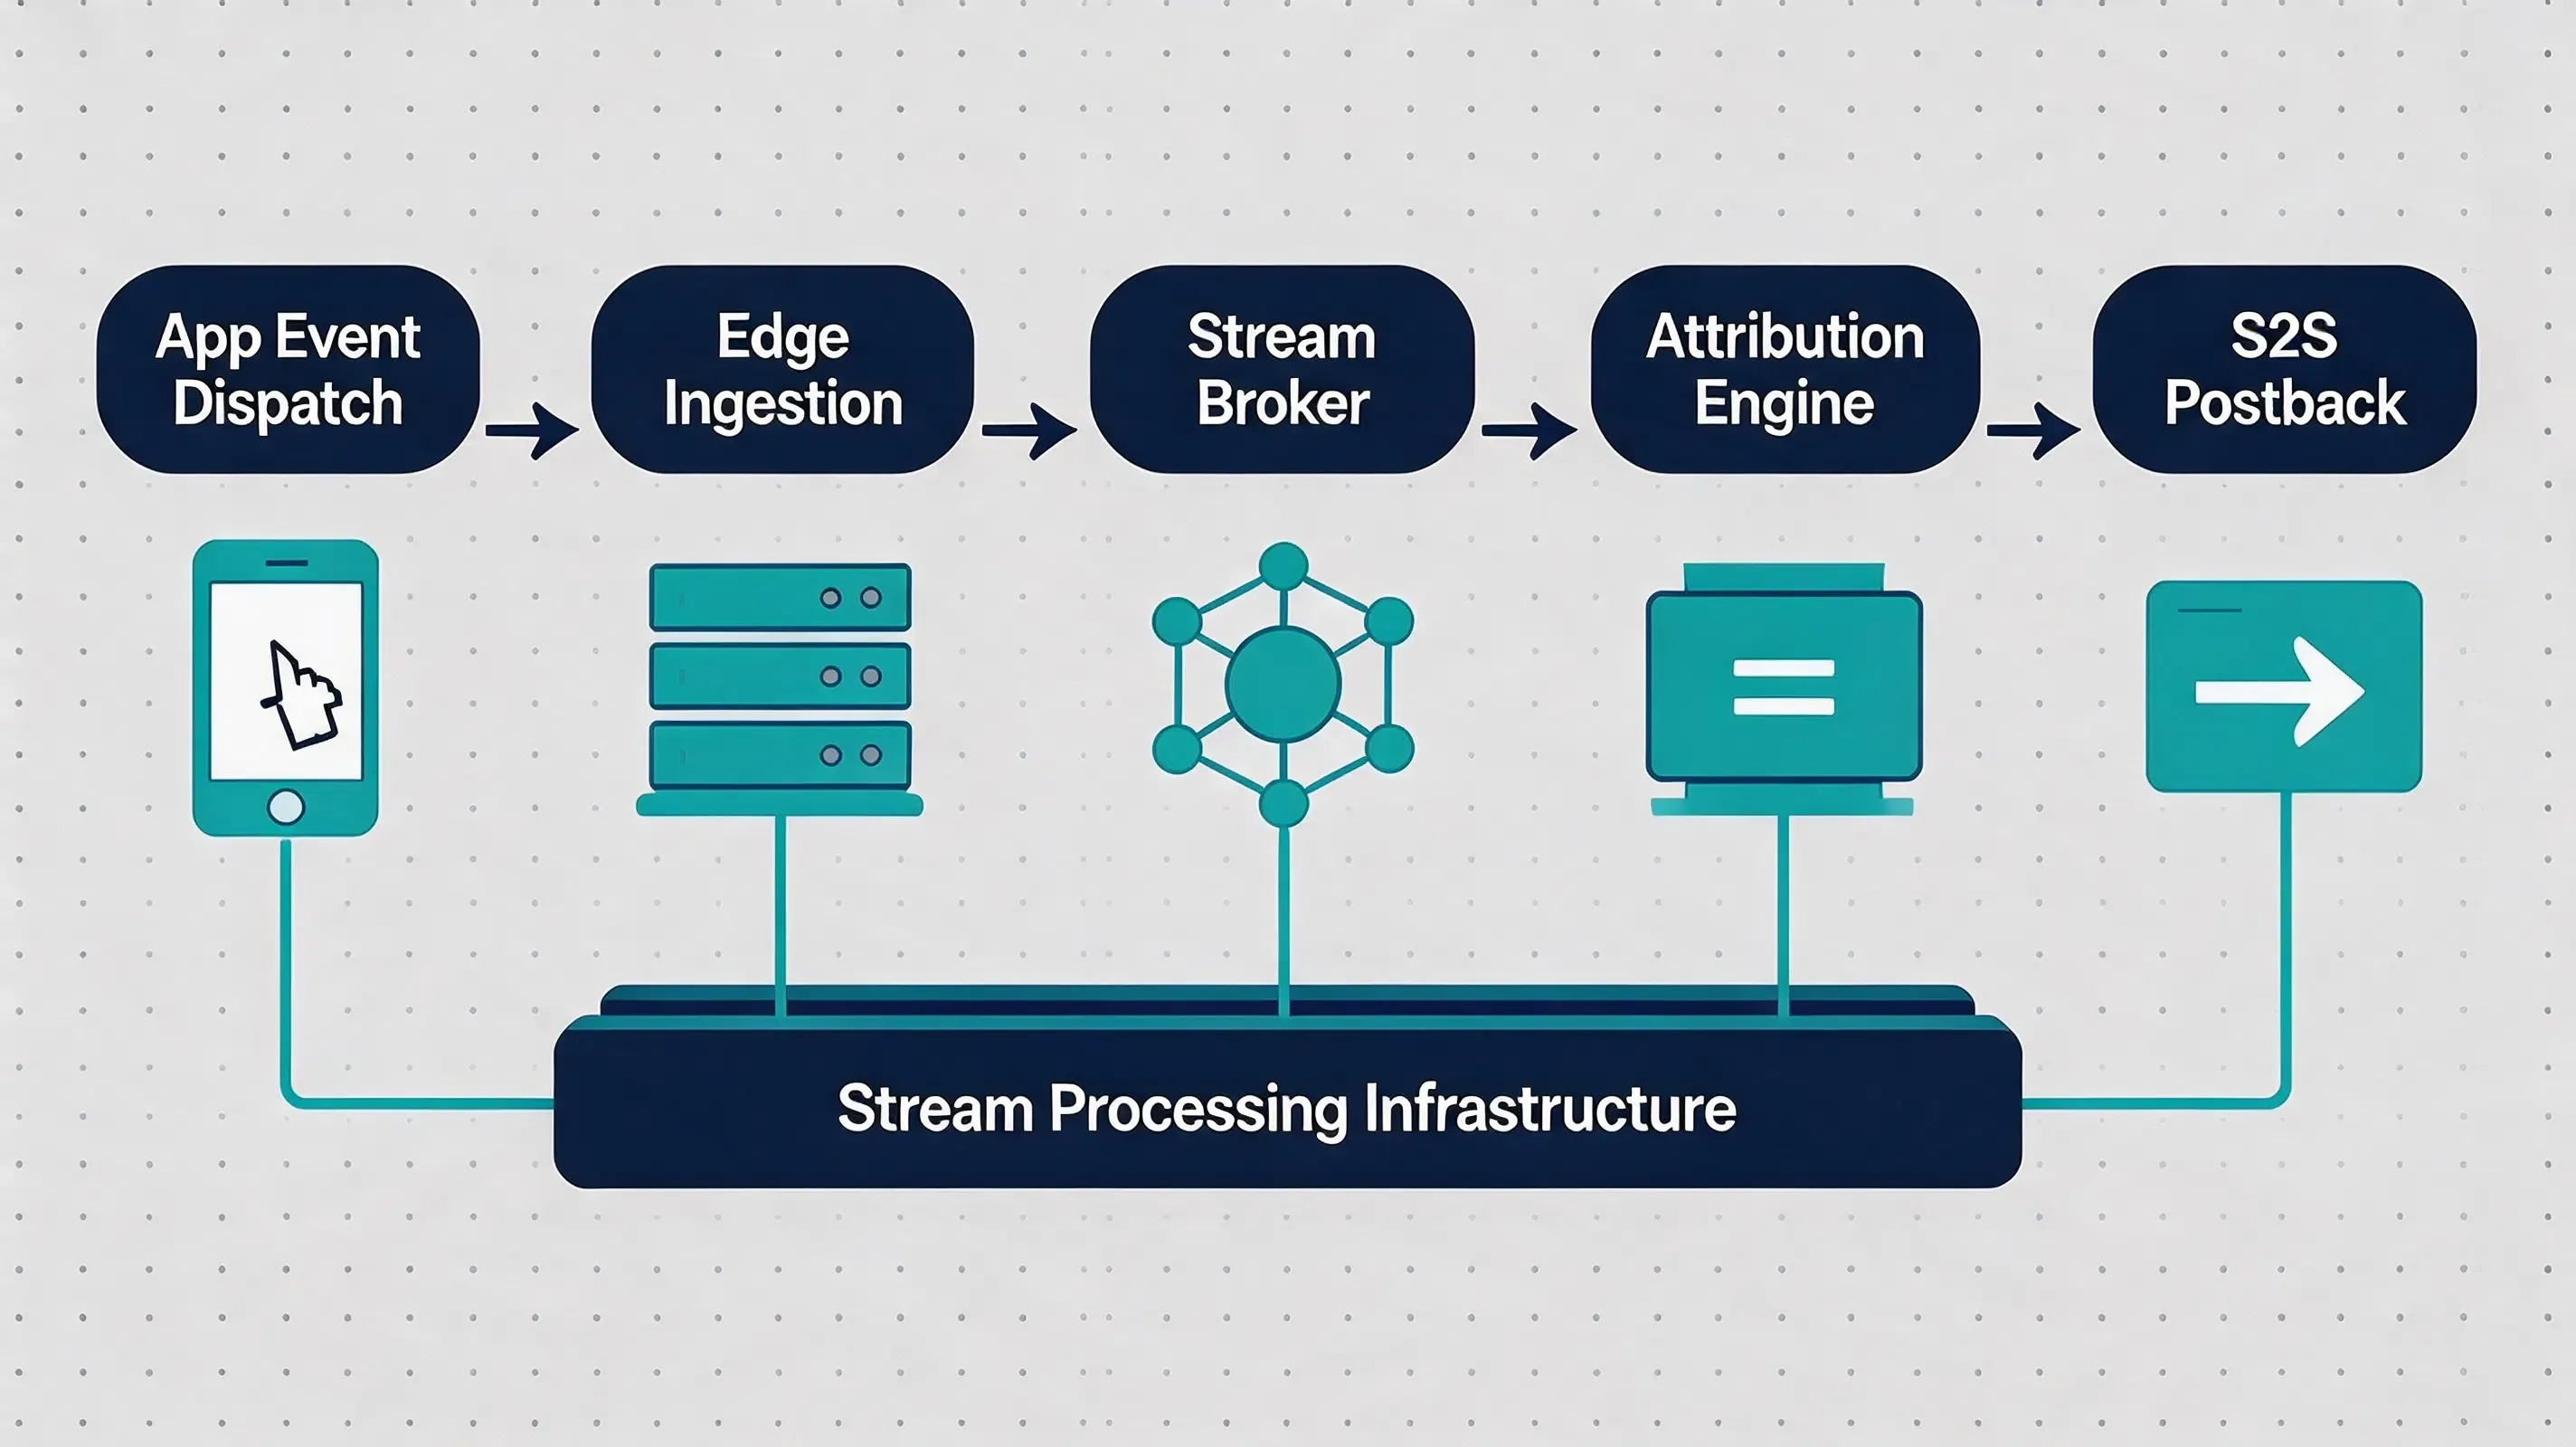
[Mobile App User Event] ──> [Mobile SDK Event Dispatch]
│
▼
[Edge Ingestion Node] (Timestamping & Verification)
│
▼
[Stream Processing Broker]
│ │
┌─────────────┘ └─────────────┐
▼ ▼
[Reporting Storage Layer] [Low-Latency S2S Postback Dispatch]
(Near real-time processing target) (DSP Receives Updated Conversion Signals)
Structuring Low-Latency S2S Event Payloads for Real-Time Delivery
Standardizing Real-Time Conversion Event Payload Fields
To maintain rapid execution across network dispatches, S2S event postback payloads must remain lightweight and strictly structured. Payload bloat increases network serialization time and memory usage across webhook workers.
Developers can reference the raw data export documentation for technical specifications regarding S2S event postbacks and raw data fields.
The schema below illustrates a real-time S2S conversion postback payload generated upon event attribution. Note: The following schema is an illustrative example (example payload for conceptual illustration only) and does not represent a production API contract:
{
“event_type”: “s2s_realtime_conversion_postback”,
“app_id”: “com.example.app”,
“postback_metadata”: {
“transaction_id”: “tx_realtime_9988776655”,
“event_timestamp_utc”: “2026-08-10T08:24:00.123Z”,
“dispatch_timestamp_utc”: “2026-08-10T08:24:00.145Z”,
“example_ingestion_latency_ms”: 12,
“example_processing_latency_ms”: 10
},
“attribution_data”: {
“attributed_network”: “media_source_alpha”,
“campaign_id”: “cmp_rtb_scale_77”,
“ad_group_id”: “ag_lookalike_09”,
“click_timestamp_utc”: “2026-08-10T08:10:12Z”,
“attribution_type”: “last_click_s2s”
},
“event_payload”: {
“event_name”: “in_app_purchase”,
“currency”: “USD”,
“event_value_cents”: 1999
},
“verification”: {
“nonce”: “c1f3a2b4e5d6f7a8b9c0d1e2f3a4b5c6”,
“signature_hmac_sha256”: “example_signature_value”,
“payload_validation”: “example_only”
}
}
Request Authentication using Dynamic HMAC Signatures
A sender can generate an HMAC-SHA256 signature over the request payload and selected metadata using a shared secret. The receiving ad network verifies the signature header upon arrival. Because HMAC calculations execute quickly, cryptographic authentication secures postback streams against data spoofing without degrading overall processing throughput.
How to Troubleshoot Common Causes of Postback Caching and Event Latency
Identifying Client-Side Bottlenecks: Network Retries and Offline Event Queuing
When diagnosing postback delays, engineers must distinguish between client-side transmission latency and server-side processing queues. If a mobile device loses network connectivity, the mobile SDK queues conversion events locally in persistent device storage.
Once connectivity is restored, the SDK flushes the local queue, sending the accumulated events to the ingestion endpoint. These events bear historical event timestamps but recent arrival timestamps. Attribution engines handle this by attributing the event based on the original event timestamp while processing postbacks according to configured network lookback rules.
Ad Network API Rate Limits and Webhook Rejection
Server-side postback latency can also occur if receiving ad network endpoints enforce strict HTTP rate limits. If an MMP attempts to fire thousands of concurrent conversion webhooks during a traffic spike, the receiving network server may return HTTP 429 Too Many Requests responses.
To handle rate limiting without losing data, postback workers implement exponential backoff retry policies with jitter, where random_jitter introduces a small randomized offset to avoid synchronized retries across workers:
Exponential backoff prevents queue crashes while ensuring that postbacks are redelivered as soon as rate limits clear.
Diagnosing Server-Side Queue Congestion
During large promotional events or traffic surges, ingestion queues can experience temporary consumer lag if processing capacity is undersized. Monitoring pipeline health requires tracking key operational metrics:
-
Consumer Group Lag: The delta between the latest written message in the stream broker and the message currently processed by workers.
-
Webhook Processing Latency: The total elapsed time from HTTP receipt to S2S postback dispatch.
-
HTTP Status Distribution: Tracking the ratio of successful delivery responses versus rate limit errors from receiving network webhooks.
Maintaining autoscaling policies on worker nodes helps ensure that processing lag remains minimal even during major traffic surges.
Frequently Asked Questions (FAQ)
Does event streaming reduce S2S postback latency?
Why are MMP postbacks delayed?
What causes S2S postback latency?
What is the difference between batch processing and event streaming?
How fast can event streaming deliver S2S postbacks?
Does event streaming replace MMP attribution processing?
How does event streaming improve conversion tracking?
How does real-time reporting help mobile attribution?
Key Takeaways
-
Eliminating Batch Lags: Event streaming architectures replace batch processing queues with event-driven stream ingestion, reducing processing lags and enabling prompt S2S postbacks.
-
Optimizing DSP Bidding: Delivering conversion postbacks quickly allows programmatic ad algorithms to adjust bid prices and frequency caps efficiently, reducing spend waste on non-converting traffic.
-
Reducing Reporting Discrepancies: Low-latency S2S webhook delivery can reduce timing-related discrepancies between MMP and advertising-platform reporting.
Summary
To reduce programmatic attribution latency, mobile marketing architectures can adopt real-time stream ingestion pipelines. Transitioning away from legacy batch processing allows ad bidding algorithms to receive timely conversion feedback, optimizing campaign ROAS and reducing dashboard discrepancies.
As mobile measurement systems handle increasing event volumes, low-latency S2S event pipelines will remain critical for processing event payloads and first-party conversion events. By implementing lightweight SDK components paired with real-time stream processing, measurement platforms provide the infrastructure needed to maintain responsive reporting and ad network synchronization.
Developers implementing mobile attribution pipelines can reference mobile attribution SDK documentation or register an account on the OpoInstall developer console for SDK integration and event delivery workflows.
Related Materials
-
Related Articles:
-
What Is Multi-Touch Attribution in Mobile Marketing?
-
How Mobile Measurement Partners Work
-
SKAdNetwork vs MMP Attribution
-
Incrementality Testing for App User Acquisition
-
-
Concepts: Event Streaming Architecture, S2S Postback Delivery, Mobile Attribution Infrastructure, Conversion Event Pipeline
-
Technologies: Event Streaming, Webhooks, Stream Processing, Real-Time Analytical Database
-
APIs: Mobile attribution event logging APIs, Apple SKAdNetwork Postback API, Google Play Install Referrer API
-
Official Documentation & References:
Share this article