What is the difference between first-touch, last-touch, and multi-touch attribution models? First-touch, last-touch, and multi-touch attribution models determine how mobile marketers distribute conversion credit across user acquisition touchpoints. As mobile acquisition channels expand across paid search, social ads, influencers, and retargeting campaigns, mobile app attribution models provide the measurement framework to evaluate channel contribution across user journeys.
An attribution model is a quantitative rule or mathematical framework that determines how conversion credit and revenue value are assigned across marketing touchpoints before a conversion event. By assigning fractional or single-point credit, these models enable marketers to evaluate the true acquisition efficiency of individual media channels.
Mobile measurement platforms (MMPs) such as AppsFlyer, Adjust, Branch, and OpoInstall apply attribution models to reconcile campaign touchpoints, installs, post-install events, and revenue signals across advertising channels.
Jump to: Quick Comparison Table | Attribution vs Window | Attribution vs Incrementality | Frequently Asked Questions
Quick Answer
In mobile marketing, an attribution model is not a tracking mechanism itself. It is the decision rule applied during attribution processing to determine which touchpoint receives conversion credit. First-touch measures discovery, last-touch measures final conversion influence, and multi-touch evaluates the combined contribution of multiple interactions.
- Choose Last-Touch Attribution when: Your product features a short purchase cycle (under 24 hours), and users typically convert immediately after a single ad interaction.
- Choose Multi-Touch Attribution when: Your app involves multi-channel journeys (such as paid search, social ads, and influencer campaigns) or subscription models requiring multi-week consideration.
- Choose Data-Driven Attribution when: Your team has sufficient conversion volume and statistically meaningful historical touchpoint data to train contribution models.
Quick Comparison Table
The table below summarizes how conversion credit is distributed across single-touch and multi-touch attribution models:
| Model | Best For | Main Advantage | Main Limitation |
|---|---|---|---|
| First Touch | Brand discovery campaigns | Measures initial acquisition origin | Ignores downstream conversion drivers |
| Last Touch | Short-cycle impulse apps | Simple to implement and reconcile | Overvalues final ad interaction |
| Multi-Touch | Complex consideration journeys | Distributes fractional credit across channels | Requires log-level data integration |
Attribution Model Selection Checklist
- Use Last-Touch Model if:
- ✓ Campaigns run on single-channel CPI models.
- ✓ Conversion cycle completes within 24 hours of first ad exposure.
- ✓ User journeys involve minimal intermediate nurturing touchpoints.
- Use Multi-Touch Model if:
- ✓ Ad spend is distributed across multiple paid networks, search, and social channels.
- ✓ Products require multi-week user consideration (e.g., subscription apps, fintech, B2B SaaS).
- ✓ SAN networks (like Meta Ads and Google Ads) report overlapping conversion claims.
- Use Data-Driven Model if:
- ✓ Campaign volume generates tens of thousands of monthly conversions.
- ✓ Data infrastructure supports exporting event-level touchpoint logs.
Common Mobile Attribution Model Types
Mobile attribution frameworks are categorized into three structural paradigms depending on credit distribution rules:
-
Single-Touch Attribution: Assigns 100% of conversion credit to a single interaction. Includes First-Touch (crediting the initial discovery touchpoint) and Last-Touch (crediting the final interaction within the attribution window).
-
Rule-Based Multi-Touch Attribution: Applies fixed algorithmic percentages across all recorded touchpoints. Includes Linear (equal credit), Time-Decay (exponential recent credit), and Position-Based (U-shaped credit).
-
Algorithmic Attribution: Uses machine learning to calculate incremental touchpoint contribution dynamically.
Mobile Attribution Models
│
├── Single-Touch Attribution
│ ├── First-Touch Attribution
│ └── Last-Touch Attribution
│
├── Rule-Based Multi-Touch Attribution
│ ├── Linear Attribution
│ ├── Time-Decay Attribution
│ └── Position-Based Attribution (U-Shaped)
│
└── Algorithmic Attribution
└── Data-Driven Machine Learning Models
Mobile Attribution Industry Context
According to mobile measurement industry benchmarks, mobile attribution evolved from simple install-level measurement toward event and revenue-based attribution as mobile advertising ecosystems became more complex.
Early Cost-Per-Install (CPI) campaigns commonly relied on last-touch attribution because conversion paths were short and dominated by performance display ads and paid acquisition channels. As subscription apps, gaming monetization loops, and cross-channel acquisition expanded, marketers increasingly adopted multi-touch and data-driven attribution models to analyze assisted conversions and evaluate upper-funnel media spend.
Modern attribution architectures unify click logs, impression data, app store install signals, post-install conversion events, and revenue callbacks to evaluate acquisition quality beyond the initial download.
| Model | Best For | Main Advantage | Main Limitation |
|---|---|---|---|
| First-Touch | Brand discovery campaigns | Measures initial acquisition origin | Ignores downstream conversion drivers |
| Last-Touch | Short-cycle impulse apps | Simple to implement and reconcile | Overvalues final ad interaction |
| Multi-Touch | Complex consideration journeys | Distributes fractional credit across channels | Requires log-level data integration |
Why Attribution Model Selection Affects Marketing Performance
Selecting an inappropriate attribution model introduces inaccurate performance reporting into campaign evaluations. Historically, growth teams relied on single-touch frameworks—specifically last-touch measurement—due to their simplicity. However, assigning 100% of conversion credit to the final ad engagement ignores preceding discovery and consideration interactions that originally guided the user into the acquisition funnel.
This single-point bias creates financial risks in media buying. Upper-funnel campaigns, such as video awareness ads or influencer promotions, frequently receive zero conversion credit despite generating initial user interest. Consequently, marketing teams may mistakenly cut funding for high-performing discovery channels, redirecting budgets entirely into bottom-of-funnel retargeting ads that merely claim final credit for users who were already likely to convert.
Evaluating marketing efficiency requires evaluating how different touchpoints contribute to a single acquisition. An optimal attribution model provides balanced visibility across the entire user journey, allowing marketing teams to calculate true Return on Ad Spend (ROAS) and optimize Customer Acquisition Costs (CAC) across complex media mixes.
Comparing Single-Touch and Multi-Touch Attribution Frameworks
At a basic level, mobile campaign measurement is divided into single-touch and multi-touch attribution frameworks. Each framework processes user interaction data differently:
- Single-Touch Attribution: Evaluates a user journey by selecting a single interaction—either the very first or the very last recorded click or impression—and assigning 100% of the conversion value to that single point.
- Multi-Touch Attribution (MTA): Captures available user interactions prior to conversion, applying weighting rules to distribute fractional credit among all eligible touchpoints.
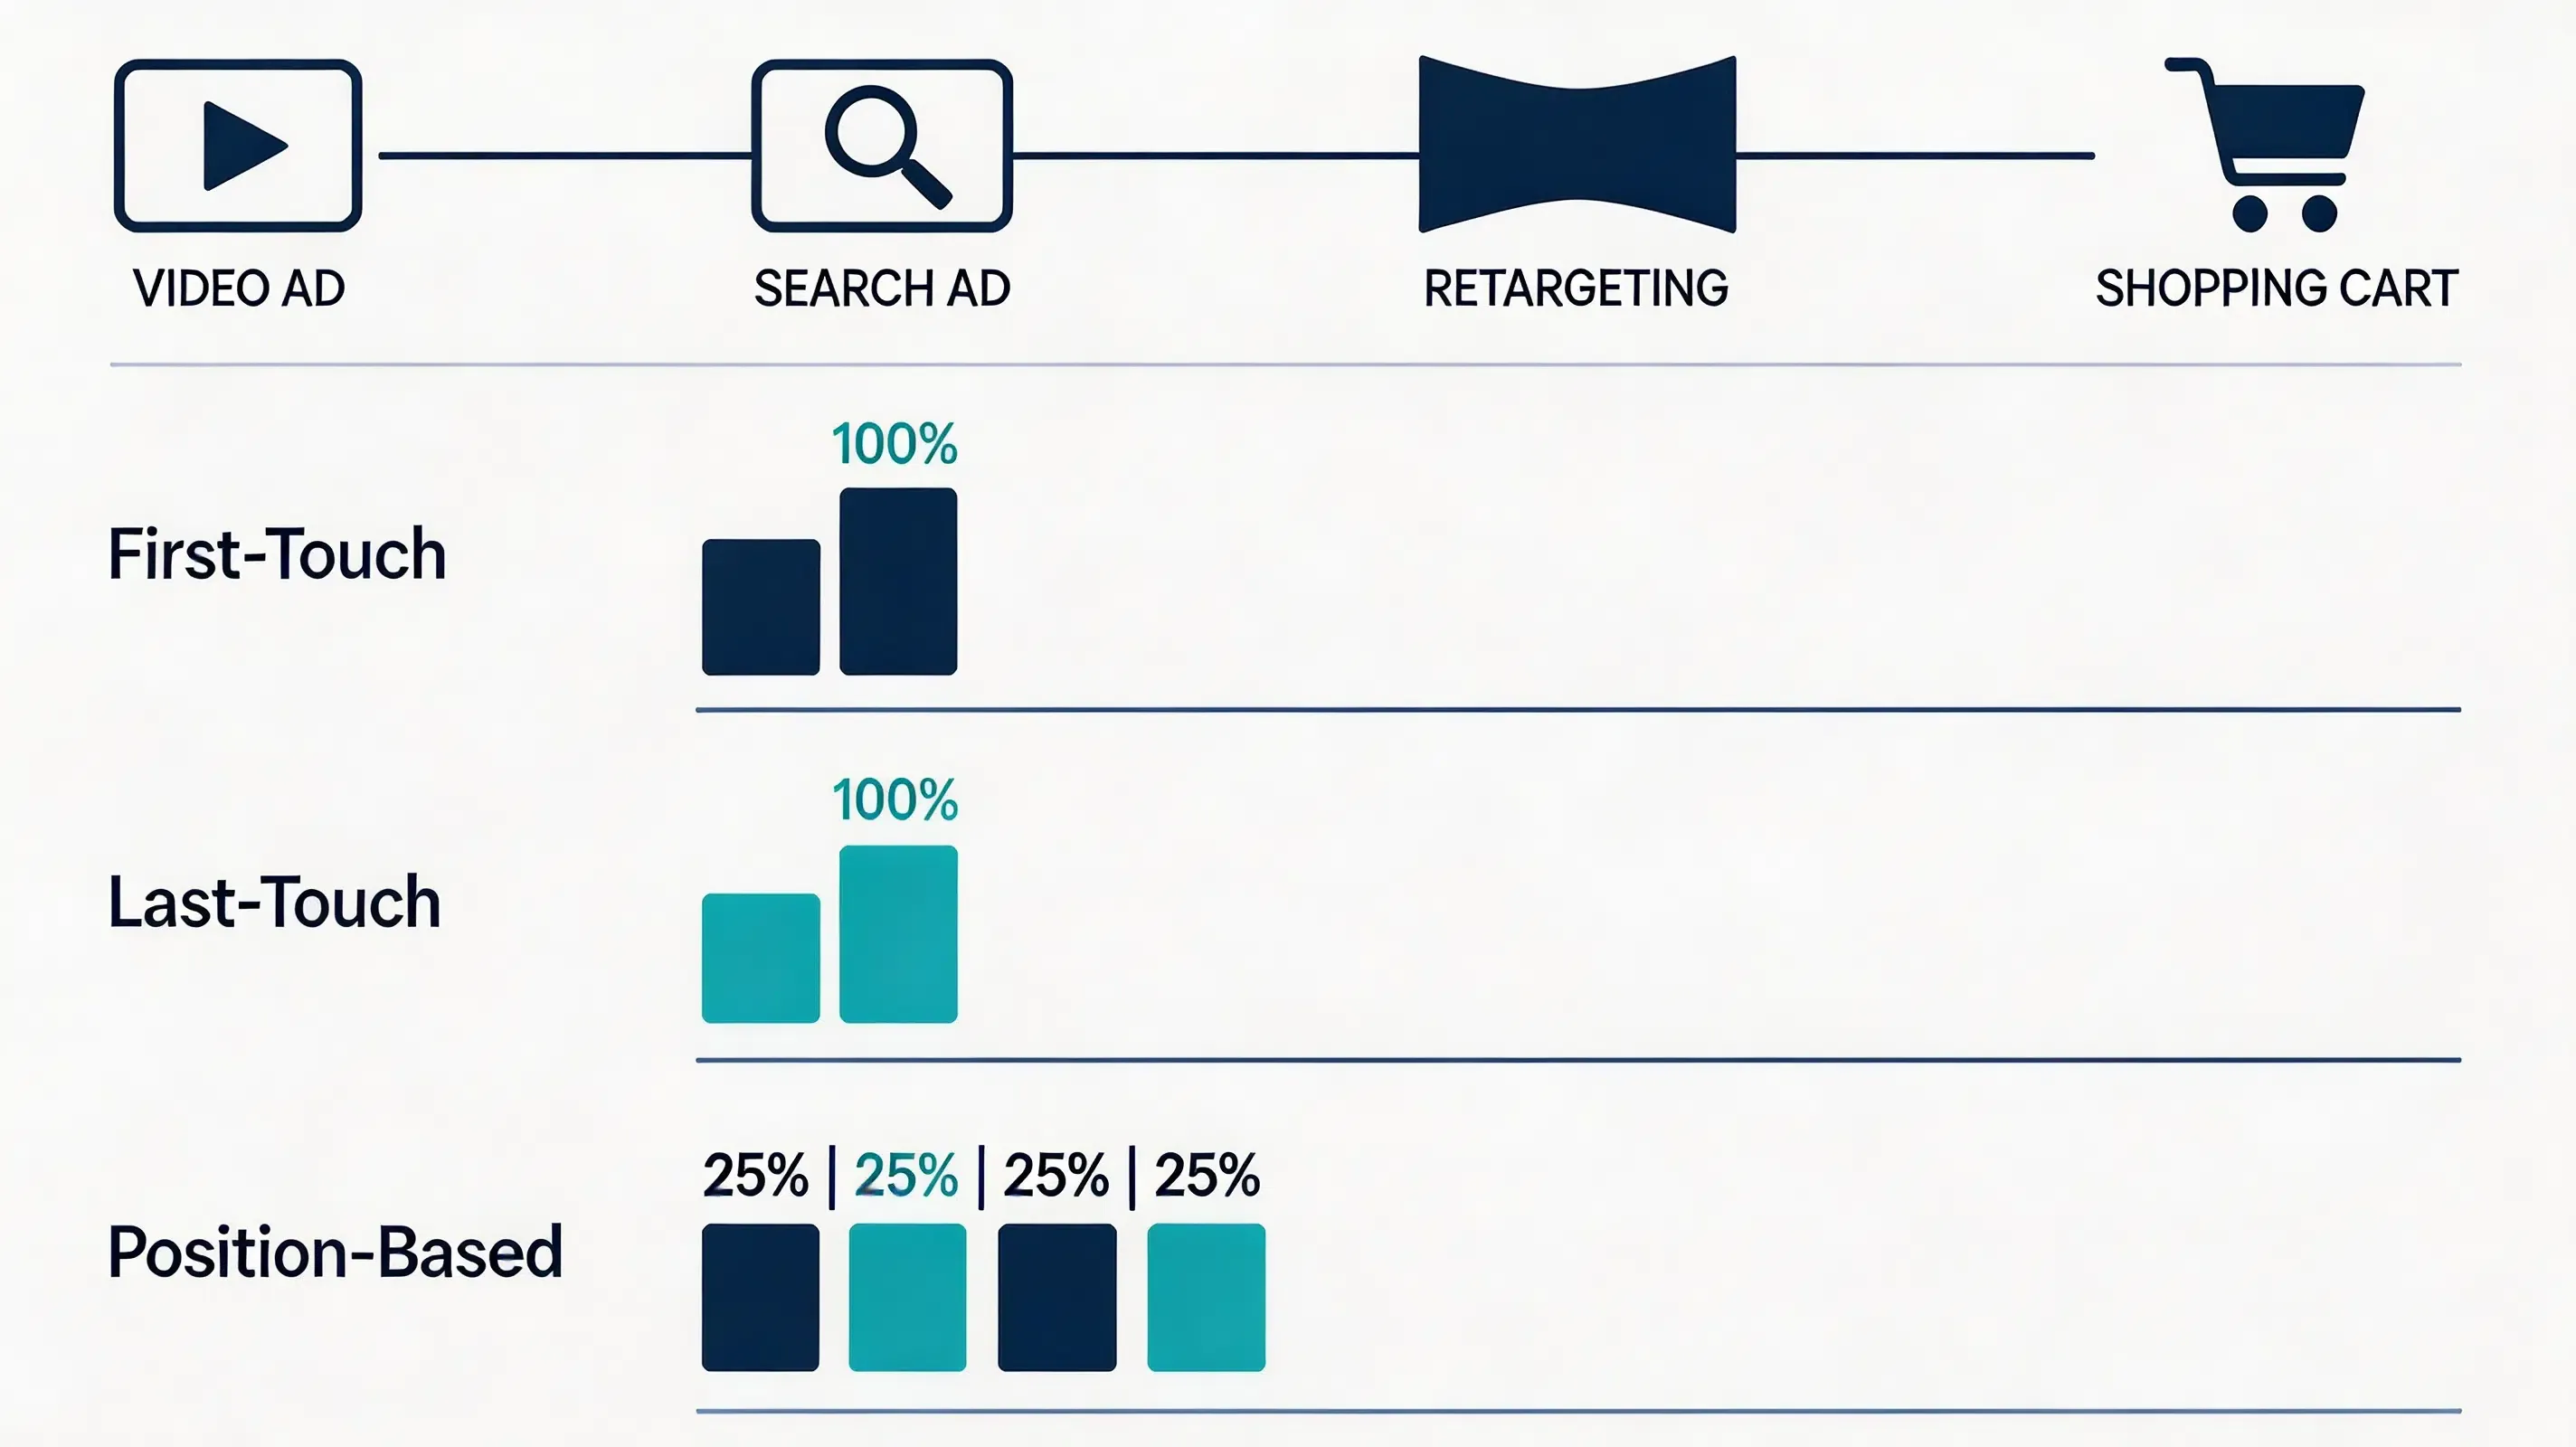
To illustrate how attribution models assign conversion credit across a multi-channel user journey, consider a 30-day conversion cycle resulting in a $49.99 annual subscription purchase:
- Day 0: User views a TikTok video ad and clicks the link (Brand Discovery).
- Day 3: User searches for the app on Google Paid Search and clicks a text ad.
- Day 7: User clicks a Meta Ads retargeting banner.
- Day 30: User completes a $49.99 subscription purchase inside the application.
| Model | TikTok (Day 0) | Google Search (Day 3) | Meta Retargeting (Day 7) | Verified Purchase ($49.99) |
|---|---|---|---|---|
| First-Touch | $49.99 (100%) | $0.00 | $0.00 | $49.99 |
| Last-Touch | $0.00 | $0.00 | $49.99 (100%) | $49.99 |
| Linear | $16.66 (33.3%) | $16.66 (33.3%) | $16.66 (33.3%) | $49.99 |
| Position-Based (40/20/40) | $19.99 (40%) | $10.00 (20%) | $20.00 (40%) | $49.99 |
| Data-Driven (Algorithmic) | Dynamic ML Weight | Dynamic ML Weight | Dynamic ML Weight | $49.99 |
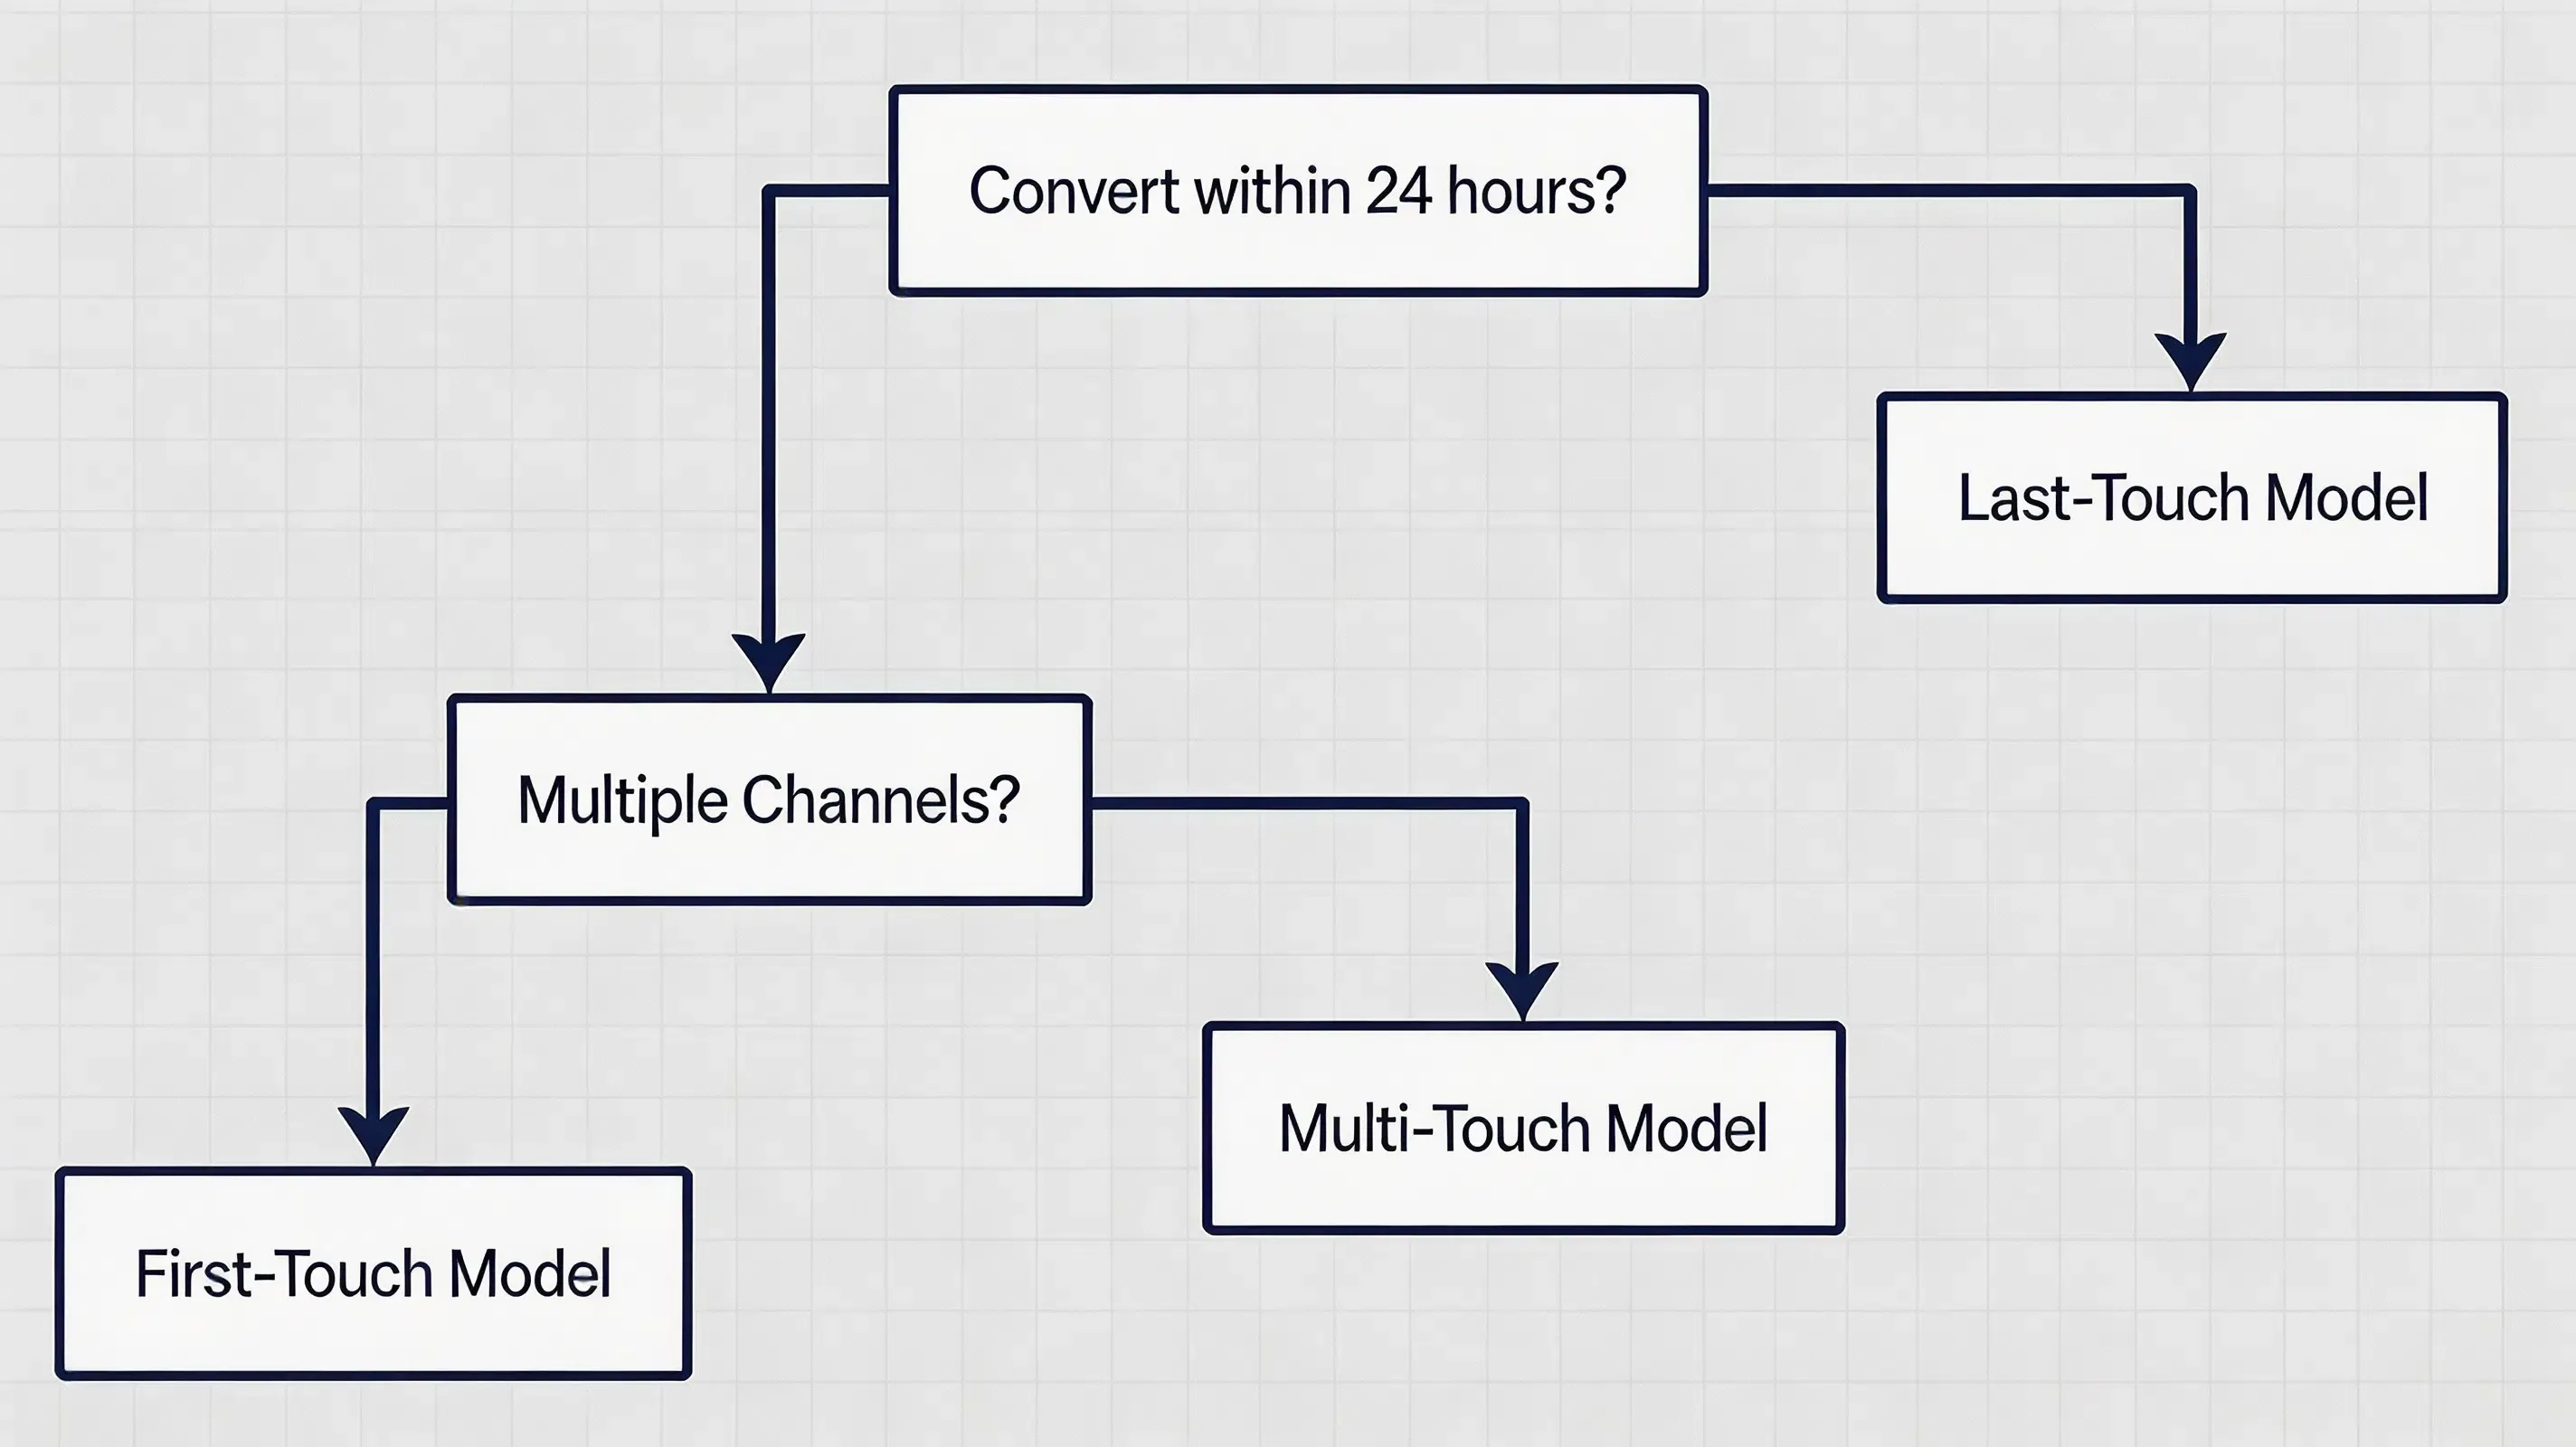
To decide between these approaches quickly, data teams use the following decision flow based on user decision timelines:
Do users convert within 24 hours of first ad exposure?
       │
      Yes ──> Last-Touch Model
       │
       No
       │
Do users interact with multiple ad channels before converting?
       │
      Yes ──> Multi-Touch Model (Position-Based or Time Decay)
       │
       No ──> First-Touch or Linear Model
How Attribution Models Assign Conversion Credit
Attribution models use specific weighting rules to assign credit across recorded campaign touchpoints. Growth teams typically select from five primary rule-based models depending on their conversion complexity:
Last-Touch Model
- Credit Allocation Rule: Assigns 100% of conversion credit to the last eligible click, or view-through impression where supported, within the attribution window before conversion.
- Credit Formula: Final touchpoint credit = 100% of conversion value.
- Use Case: While highly straightforward, this model neglects discovery channels, creating a heavy bias toward retargeting and branded search.
First-Touch Model
- Credit Allocation Rule: Assigns 100% of the credit to the initial recorded marketing touchpoint that introduced the user to the app.
- Credit Formula: Initial touchpoint credit = 100% of conversion value.
- Use Case: This model highlights brand awareness channels but provides zero visibility into downstream retargeting or final conversion drivers.
Linear Attribution Model
- Credit Allocation Rule: Distributes conversion value equally among all recorded touchpoints within the conversion window.
- Credit Formula: Credit per touchpoint = 1 ÷ N, where N represents the total number of recorded touchpoints.
- Use Case: While balanced, this model treats low-intent ad views with the same weight as high-intent conversion clicks.
Time-Decay Attribution Model
- Credit Allocation Rule: Uses a decay formula to assign higher credit weights to touchpoints that occurred closer in time to the final conversion.
- Time-Decay Weighting Formula: Credit weight = 2^(-t/h), where t represents elapsed time and h represents the selected half-life parameter. After calculating each touchpoint weight, values are normalized so the total attribution credit equals 100%.
- Use Case: Touchpoints closer to conversion receive higher credit, acknowledging that recent engagements exert a stronger influence on the purchase decision.
Position-Based Model
- Credit Allocation Rule: Distributes weighting across touchpoint sequences, assigning higher weights to initial discovery and final conversions while splitting the remaining credit among intermediate touches.
- Middle-Touch Allocation: First Touch = 40%, Last Touch = 40%, Middle Touches = 20% divided equally among intermediate interactions. When a journey contains only two touchpoints, platforms may apply simplified rules such as equal allocation depending on configuration.
- Use Case: A common U-shaped implementation assigns 40% credit to the first touch, 40% to the last touch, and distributes the remaining 20% equally among middle interactions, balancing brand discovery with purchase execution.
Rule-Based vs Algorithmic Attribution Models
While rule-based attribution models apply fixed static percentages across touchpoints, algorithmic or data-driven attribution models utilize machine learning to analyze user interaction chains dynamically.
Algorithmic models estimate the relative contribution probability of touchpoints using statistical and machine learning models based on historical conversion paths:
- Markov Chain Models: Analyze transition probabilities between touchpoints and estimate channel contribution through removal effects.
- Shapley Value Models: Applies cooperative game theory mechanics to evaluate the marginal incremental contribution of each advertising channel across touchpoint combinations.
Although algorithmic models adapt well to complex media mixes, rule-based models remain easier to audit, transparent to configure, and simpler to reconcile across third-party marketing channels.
Deterministic vs Probabilistic Attribution
A fundamental technical distinction in campaign measurement is the mechanism used to match user interactions across environments:
- Deterministic Attribution: Matches user touchpoints using explicit, unique identifiers (such as authorized IDFA, login IDs, or authorized device identifiers). Deterministic matching offers near-perfect accuracy but is limited by privacy consent rates.
- Probabilistic Attribution: Matches user interactions by evaluating contextual matching signals (such as browser environment and session metadata) when explicit identifiers are restricted. Probabilistic modeling provides broader reach under modern privacy constraints.
Click-Through vs View-Through Attribution
A foundational distinction in campaign measurement is the difference between click-through and view-through attribution:
- Click-Through Attribution (CTA): Requires an explicit user interaction (an ad click) prior to conversion within an established lookback window (e.g., 7-day click window).
- View-Through Attribution (VTA): Credits an ad impression viewed by a user who subsequently converts without clicking the ad, operating within a significantly tighter lookback window (e.g., 24-hour impression window).
Most mobile measurement platform implementations prioritize click attribution over view-through attribution when both an ad click and impression fall within eligible conversion windows.
Attribution vs Incrementality: Causal Impact vs Credit Allocation
A critical distinction in modern mobile growth is understanding the difference between attribution and incrementality. Growth teams frequently confuse these two measurement frameworks:
- Attribution (Credit Allocation): Answers which channel receives credit based on pre-defined matching rules. Attribution looks backward at touchpoint chains to distribute financial value.
- Incrementality (Causal Lift): Answers what incremental conversions occurred that would not have happened otherwise. Incrementality uses A/B testing and holdout groups to measure true causal lift.
A channel may receive high attribution credit under a last-touch model (such as branded search ads), but incrementality testing might reveal that 90% of those users would have converted organically anyway. High-performing growth teams use attribution models for day-to-day campaign optimization while validating channel lift periodically through incrementality experiments.
Privacy Changes and SKAdNetwork Impact on Mobile Attribution
Modern mobile attribution must account for platform privacy frameworks, most notably Apple’s App Tracking Transparency (ATT) and SKAdNetwork (SKAN). As outlined in Apple’s SKAdNetwork documentation, IDFA availability has been significantly restricted.
These privacy changes directly alter how attribution models function on iOS devices:
- Aggregated Postback Delivery: SKAdNetwork replaces user-level attribution with privacy-preserving aggregated campaign measurement for users who do not authorize tracking. These conversion values represent aggregated post-install activity signals rather than user-level event attribution.
- Conversion Value Mapping: Marketers must map downstream in-app events to fine-grained conversion values (earlier SKAdNetwork versions used a 6-bit fine conversion value system, while newer versions introduced additional measurement mechanisms including coarse values and multiple postbacks) within strict postback time windows.
- Shift to Modeled and Probabilistic Attribution: Growth teams increasingly combine SKAN aggregate postbacks with privacy-compliant first-party session tokens and incrementality testing to evaluate channel performance accurately.
Attribution Fraud and Measurement Risk
Securing mobile attribution requires understanding how invalid traffic and ad fraud undermine attribution model calculations:
- Click Injection: Fraudulent scripts detect store download triggers and inject simulated ad clicks milliseconds before first launch, stealing credit under last-touch models.
- Click Spamming: Malicious networks generate high-volume, low-intent background clicks to artificially increase the likelihood of claiming last-touch credit for organic installs.
- Install Hijacking: Intercepting post-install attribution signals to divert conversion credit away from legitimate discovery channels.
Preventing fraud requires Click-To-Install Time (CTIT) analysis, device-level anomaly detection, and server-side validation mechanisms.
How SANs Affect Attribution Model Accuracy
A major challenge in mobile app attribution is managing Self-Attributing Networks (SANs). Major advertising channels operate as closed ecosystems that do not share device-level click logs externally. Instead, these networks claim conversion credit by querying their internal databases when an install occurs.
When a user interacts with ads on multiple self-attributing networks before installing an application, SANs generally restrict external access to user-level matching data and rely on their own internal attribution systems. Relying on self-reported network data can result in duplicated conversion reporting when claims overlap across networks.
Resolving this conflict requires deploying an independent mobile measurement platform (MMP). Independent attribution platforms resolve these conflicts by normalizing conversion timestamps, deduplicating overlapping claims, and applying consistent attribution rules across advertising channels.
How to Choose an Attribution Model for Your Business
Selecting the optimal attribution model requires evaluating business type, average user decision cycles, and media channel diversity. The decision matrix below outlines recommended model frameworks based on product verticals:
| Business Type | Decision Cycle Length | User Purchase Behavior | Recommended Model |
|---|---|---|---|
| Hyper-casual Games / Utilities | Short (< 24 Hours) | Impulse downloads, single ad click | Last-Touch Model |
| Mobile E-Commerce / Retail | Medium (1 - 7 Days) | Comparison shopping, social & search | Time-Decay Model |
| Subscription Apps / Fintech | Long (1 - 3 Weeks) | Multiple trial views, retargeting | Position-Based or Data-Driven MTA |
| B2B SaaS / High Consideration | Extended (> 1 Month) | Content discovery, multi-device research | Linear or Multi-Touch MTA |
Attribution Model vs Attribution Window: What Is the Difference
Marketers frequently confuse attribution models with attribution windows. While both settings directly influence campaign performance reporting, they perform distinct measurement functions:
| Evaluation Attribute | Attribution Model | Attribution Window |
|---|---|---|
| Purpose | Decide credit allocation | Define eligible lookback period |
| Example | Last-Touch, Position-Based | 1-Day Click, 7-Day Click, 30-Day Click |
| Question Answered | Who gets credit? | Which interactions qualify? |
Understanding the Attribution Window
Setting appropriate lookback windows is equally critical. An attribution window defines the designated timeframe preceding a conversion during which prior ad clicks or impressions remain eligible to receive attribution credit. Common attribution windows include:
-
1-Day Click Attribution Window: Used for ultra-short impulse conversions, minimizing attribution claims to immediate ad engagements.
-
7-Day Click Attribution Window: A commonly used benchmark across many performance marketing channels, balancing recent intent with purchase decision lag.
-
30-Day Click Attribution Window: Applied in high-consideration subscription or enterprise products where multi-week evaluation is required.
[Initial Ad Discovery] ──> [First Touch: 40% Credit]
│
▼
[Retargeting & Content] ──> [Middle Touches: 20% Equal Split]
│
▼
[Final Search Click] ──> [Last Touch: 40% Credit] ──> [Conversion Verified]
Matching conversion windows to natural purchasing timelines prevents crediting stale ad interactions that played no active role in the user’s conversion decision.
When Teams Need Multi-Touch Attribution
Companies usually transition from single-touch to multi-touch attribution when campaign complexity exposes the limitations of last-touch reporting. Scaling applications typically adopt multi-touch frameworks under four situations:
- Multi-Channel User Journeys: Prospective users consistently interact with three or more distinct media channels (such as influencer videos, social ads, and search) prior to installing the app.
- Media Budget Expansion: Monthly advertising expenditure expands beyond single-channel testing, requiring accurate cross-channel ROAS validation.
- SAN Attribution Conflicts: Self-attributing networks report overlapping conversion claims, requiring neutral deduplication to resolve double-counted revenue.
- Subscription Retention Focus: Customer Lifetime Value depends on long-term retention rather than impulse first-day purchases, making top-of-funnel discovery channels critical to sustain.
Practical Considerations for Mobile Attribution
In real-world mobile marketing campaigns, engineering and analytics teams frequently encounter three core operational challenges that impact attribution accuracy:
- SAN Network Overlap: Major self-attributing networks frequently claim the same conversion independently, requiring a neutral backend arbiter to enforce strict deduplication rules before approving ad network payouts.
- Attribution Window Discrepancies: Different ad networks enforce different default lookback windows (e.g., 7-day click vs 1-day view), making raw campaign performance comparisons misleading unless standardized centrally.
- Post-Install Conversion Delays: High-value monetization events (such as subscription renewals or dynamic in-app checkouts) often occur weeks after the initial download, requiring persistent user ID binding.
To resolve these complexities, a reliable mobile measurement architecture maintains a strict functional separation across three measurement pipelines:
- Install Attribution: Verifies the initial download origin across app store boundaries.
- Event Attribution: Binds downstream in-app user actions to specific campaign parameters.
- Revenue Attribution: Connects financial order value back to the originating acquisition channel.
Technical Implementation and Raw Log Exports
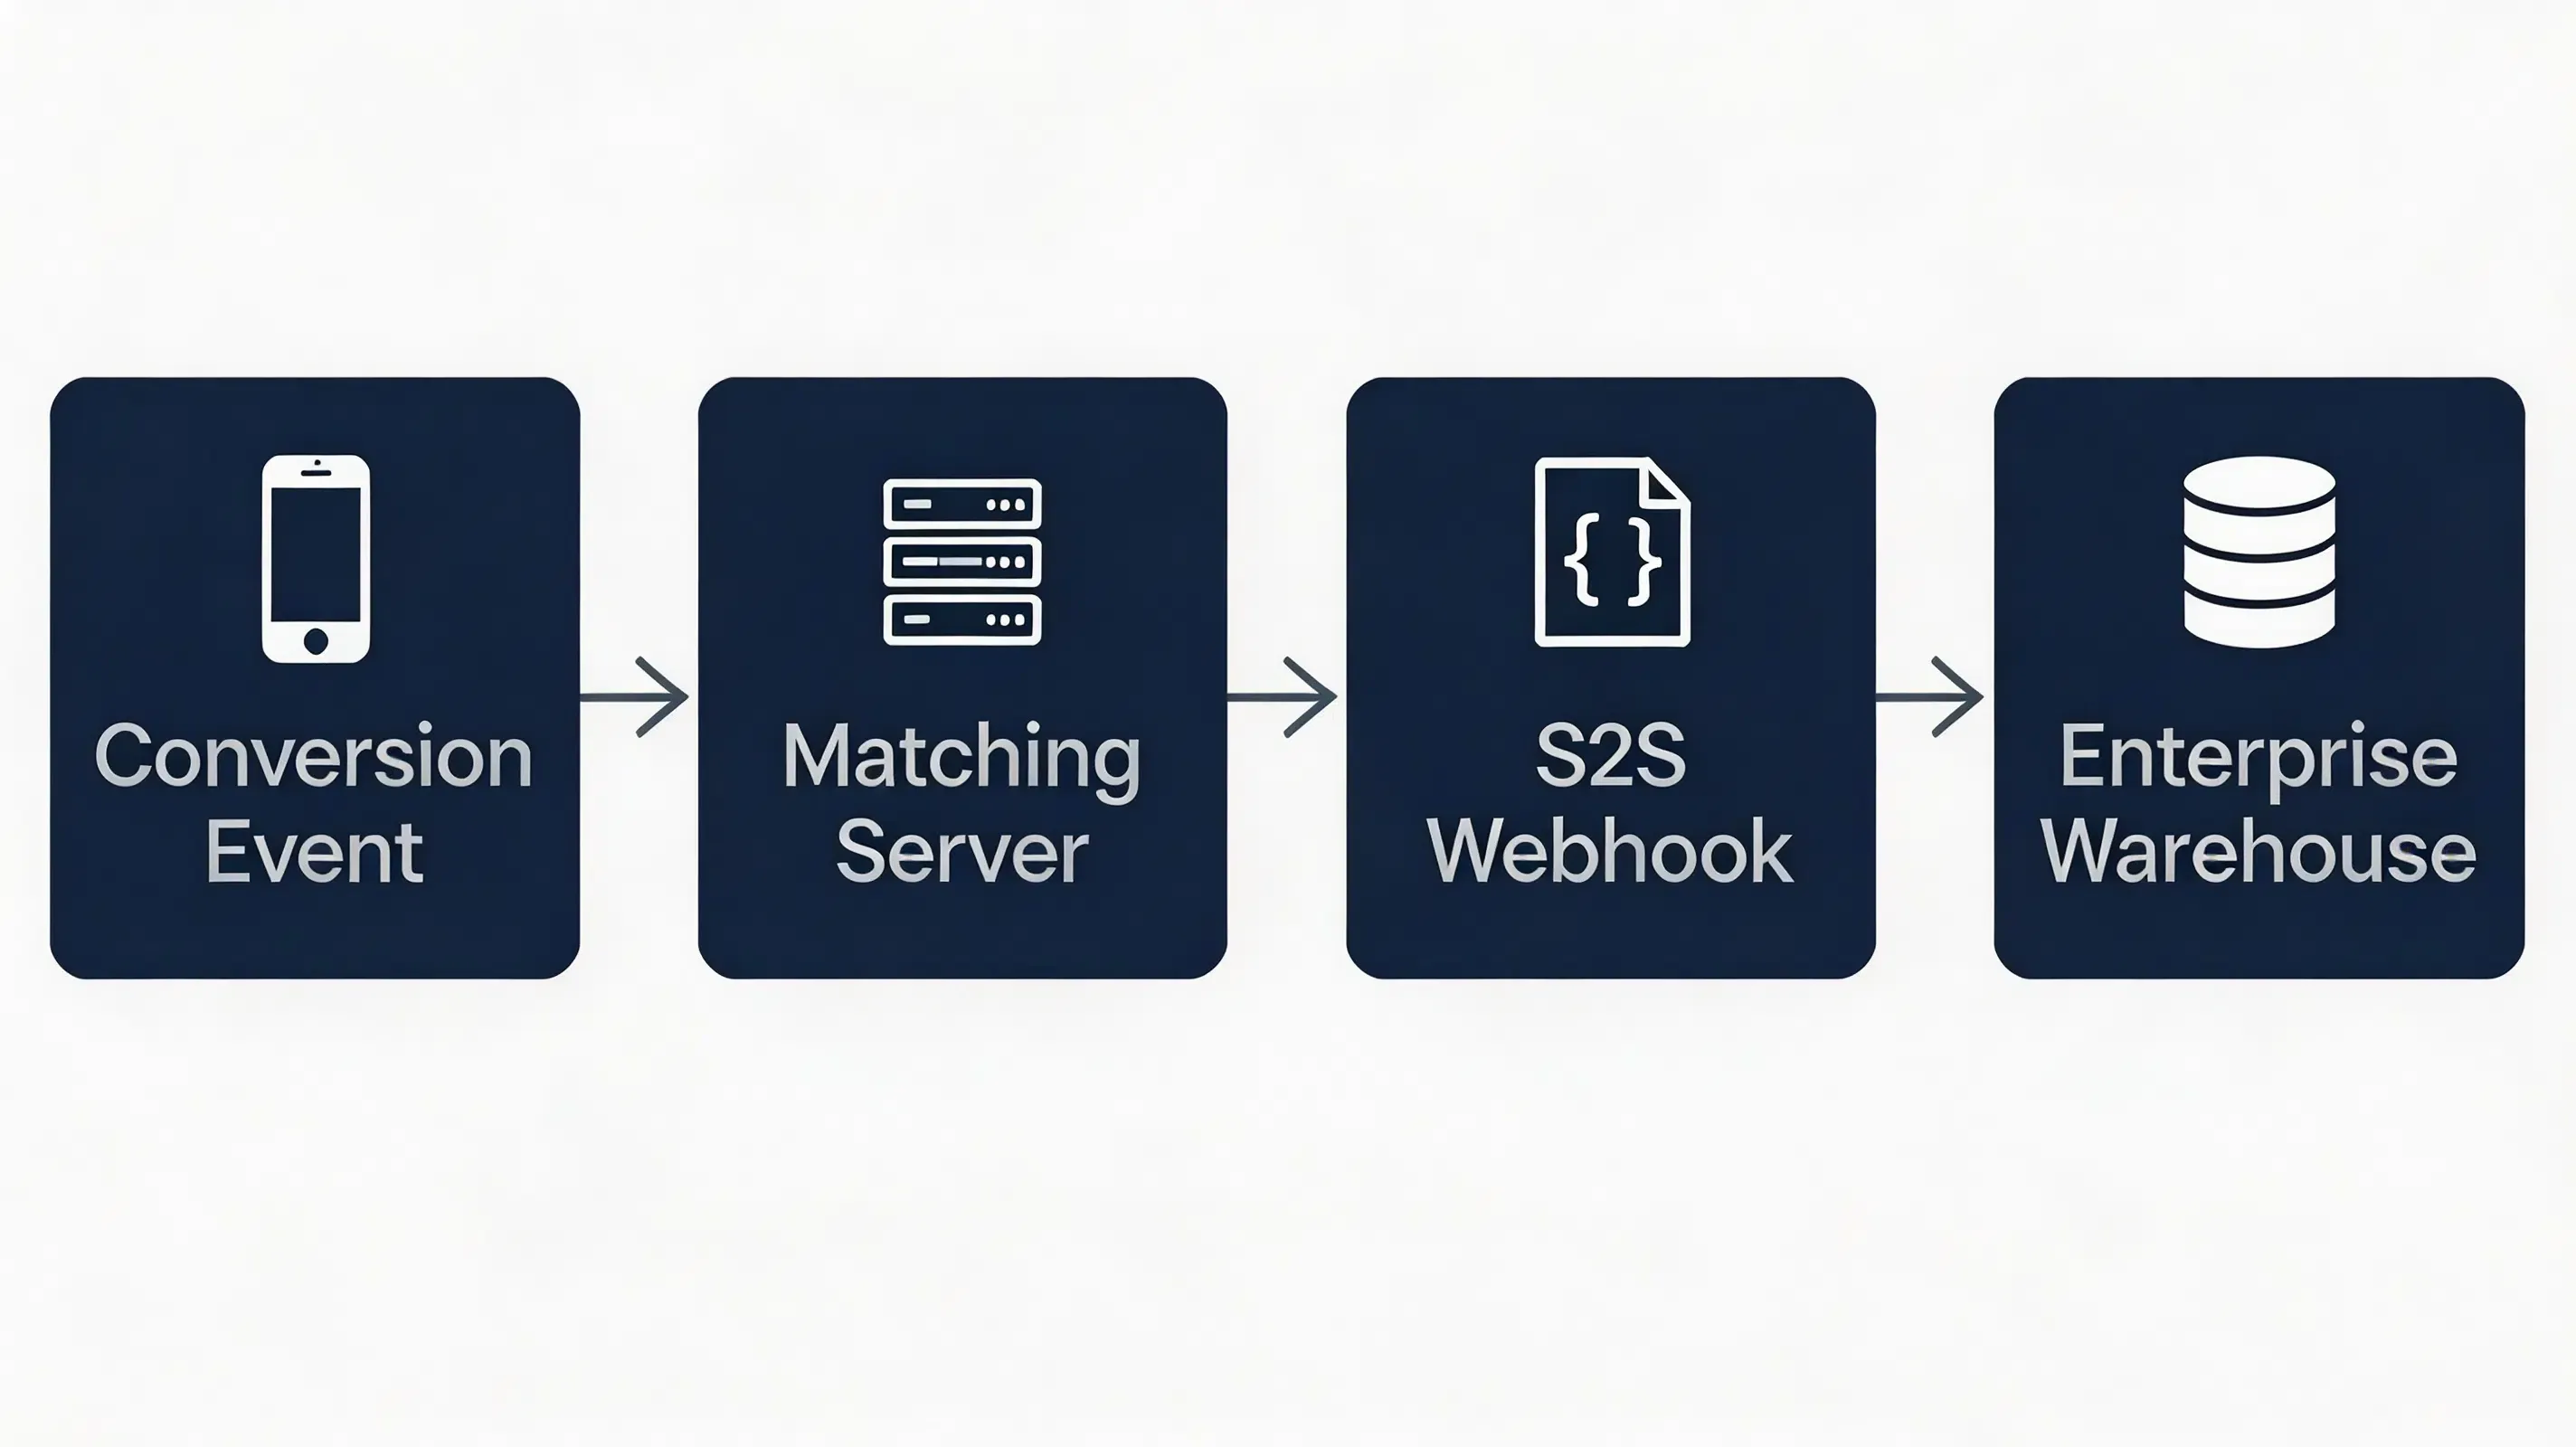
While aggregated dashboard reports provide high-level performance summaries, advanced data teams require log-level touchpoint data to execute custom algorithmic modeling. Exporting unaggregated, raw log data allows data engineers to build proprietary multi-touch weighting algorithms inside enterprise data warehouses.
Raw attribution logs capture granular event metadata, including session identifiers, touchpoint timestamps, ad creative IDs, and normalized revenue metrics expressed in integer cents. These signals may be delivered through server-to-server postbacks, APIs, or scheduled raw-data exports depending on platform capabilities. Production webhook schemas usually include additional validation fields, identifiers, and security signatures. Attribution platforms provide infrastructure for collecting attribution signals and exporting event-level data.
[Conversion Event] ──> [Matching Server] ──> [S2S Webhook Dispatch] ──> [Enterprise Warehouse]
Refer to the raw data export documentation for technical payload specifications.
{
  "event_type": "attribution_postback",
  "model_applied": "position_based",
  "touchpoint_count": 3,
  "total_revenue_cents": 4999,
  "currency": "USD"
}
// Example attribution postback payload schema
// File: postback_event_schema.json
{
  "event_type": "attribution_postback",
  "model_applied": "position_based",
  "touchpoint_count": 3,
  "total_revenue_cents": 4999,
  "currency": "USD"
}
Common Attribution Model Selection Mistakes
When evaluating and transitioning between attribution frameworks, growth teams often encounter several implementation traps:
- Using last touch for subscription products: Evaluating long-consideration apps with single-touch models undervalues top-of-funnel discovery campaigns, starving the top of the acquisition funnel.
- Comparing SAN reported installs without deduplication: Accepting self-attributing network claims directly causes double-counting, creating false revenue metrics across ad channels.
- Ignoring organic assist conversions: Failing to account for organic brand discovery alongside paid ad touchpoints leads to overspending on retargeting media.
- Setting excessively long lookback windows: Counting ad clicks that occurred weeks before a user’s purchase credits passive ad impressions that did not drive conversion intent.
Example: Evaluating Multi Channel Spends for a Scaling Mobile App
Simulated Scenario: Mobile Subscription Application Integration
Challenge
A mobile subscription application allocated marketing spend across paid search, social media ads, and influencer sponsorships. Relying exclusively on last-touch attribution made top-of-funnel video discovery channels appear unprofitable, prompting management to consider canceling awareness campaigns.
Implementation
The marketing analytics team implemented a position-based multi-touch attribution model, utilizing raw attribution exports from an independent attribution platform to deduplicate ad network claims and distribute fractional value across the user acquisition journey.
Expected Outcomes
This implementation demonstrates how multi-touch models prevent channel misallocation. During the evaluation, analysis showed that influencer campaigns contributed measurable assisted conversions, enabling the team to rebalance upper-funnel spending effectively without losing total install volume.
Lessons Learned
- Audit channel position roles: Evaluating first-touch interactions prevents prematurely cutting discovery campaigns.
- Deduplicate network claims: Processing postbacks through an independent platform eliminates double-counted conversions.
- Match models to user journeys: Selecting weighting formulas based on consideration length improves ROAS visibility.
Attribution Model Performance and Use Case Comparison
Different attribution models provide varying levels of analytical detail depending on campaign goals. The comparison below summarizes common attribution frameworks:
| Evaluation Attribute | Last-Touch Model | First-Touch Model | Linear MTA Model | Position-Based Model |
|---|---|---|---|---|
| Credit Distribution | 100% to Final Click | 100% to Initial Click | Equal Division (1/N) | First + Last Touch Weighted (commonly 40/20/40) |
| Conversion Cycle Fit | Short / Impulse | Brand Awareness | Medium Consideration | Long / High Consideration |
| Implementation Effort | Low | Low | Moderate | High (Requires Raw Logs) |
| Top-Funnel Visibility | Minimal | High | Moderate | High |
| Fraud Sensitivity | High (Click Injection) | Low | Moderate | Low |
Frequently Asked Questions
What is the difference between first-touch and last-touch attribution?
What is the difference between first-touch and multi-touch attribution?
Which is better, first-touch or last-touch attribution?
What is an attribution model in mobile advertising?
How does multi-touch attribution assign fractional conversion credit?
How do I choose between first touch and last touch attribution?
Which attribution model is best for short impulse purchase apps?
How do self-attributing networks impact multi-touch model accuracy?
Can attribution models be customized using raw data logs?
What is an attribution window?
What is the difference between an attribution model and an attribution window?
What is time decay attribution in mobile marketing?
Which attribution model does Google Ads use?
Which attribution model does Meta Ads use?
Summary and Decision Framework
Choose an advanced multi-touch attribution model when your growth objectives match the following functional criteria:
- ✓ Multi-Channel Media Mix: Ad spend is distributed across multiple paid networks, content creators, and retargeting channels simultaneously.
- ✓ Extended Conversion Consideration: The user decision cycle spans several days or weeks, involving multiple interactions prior to checkout.
- ✓ SAN Deduplication is Required: Ad networks make overlapping conversion claims that require independent backend reconciliation.
- ✓ Granular ROAS Optimization Needed: Budget allocation requires understanding top-of-funnel awareness contribution alongside bottom-of-funnel conversion.
In these scenarios, transitioning from single-touch measurement to a multi-touch attribution model provides an accurate view of channel efficiency. Platforms providing this infrastructure allow mobile teams to measure referral-driven installs while maintaining first-party data control. For teams building server-side attribution infrastructure, platforms such as OpoInstall support webhook-based postbacks and log-level attribution exports.
Reviewed by Mobile Measurement Specialist | Last updated: August 2026
Related Attribution Concepts
| Concept | Definition |
|---|---|
| Attribution Model | The mathematical rule assigning conversion value to marketing touchpoints. |
| Last-Touch Attribution | A single-touch framework assigning 100% conversion value to the final click. |
| Multi-Touch Attribution | A framework distributing conversion value across multiple touchpoints in a journey. |
| First-Touch Attribution | A single-touch framework crediting 100% conversion value to the initial discovery event. |
| Fractional Credit | The partial monetary or percentage value assigned to an individual touchpoint. |
| Raw Logs | Unaggregated, event-level data entries exported for custom analytics modeling. |
Related Materials
Related Concepts
- Install Attribution: The foundational measurement pipeline identifying application download sources.
- Customer Acquisition Cost: The total financial expenditure required to acquire a single active user.
- Self-Attributing Networks: Major ad platforms that report internal conversion counts without external validation.
Related Technologies
- Google Play Install Referrer: Google’s native API passing install-time campaign metadata on Android.
- Universal Links: Apple’s native deep linking standard bridging web actions to native screens.
- App Links: Google’s verified deep linking protocol handling custom web URLs on Android.
- Mobile Measurement Platform: Independent measurement system that unifies and deduplicates attribution signals across channels.
- SKAdNetwork: Apple’s privacy-preserving, aggregated ad attribution measurement framework.
Official Documentation / References
Share this article