How to calculate and reduce app churn rate? App churn rate should be calculated over a clearly defined eligible user cohort and inactivity window:
Churn rate measures the proportion of users who discontinue active engagement with an application over a designated measurement window. In mobile product analytics, accurately managing churn requires separating pre-activation onboarding drop-offs from post-activation lifecycle churn, enabling teams to eliminate procedural setup friction before long-term attrition occurs.
| Term | Definition | Related Entity | Search Intent Role |
|---|---|---|---|
| Churn Rate | The proportion of an active user base that discontinues engagement over time. | User Retention | Informational / Commercial |
| Onboarding Drop-Off Rate | The percentage of users abandoning sequential steps prior to core activation. | User Journey | Technical / Informational |
| App Analytics | The programmatic telemetry tracking user progression and lifecycle transitions. | Cohort Analysis | Informational |
Why Distinguishing Onboarding Drop Off from Lifecycle Churn Is Essential
The Diagnostic Blindspot of Blended Churn Metrics
Evaluating mobile application attrition through a single, aggregated churn metric creates a critical diagnostic blindspot. When analytics teams measure churn solely as the aggregate proportion of newly acquired users who fail to return after 30 days, they conflate two fundamentally different failure modes: users who abandoned the application during initial setup before experiencing functional value, and users who successfully activated but later discontinued usage due to lack of recurring utility.
A blended churn rate provides no actionable insight into where user loss occurs. If attrition happens primarily during initial account creation, identity verification, or permission prompts on Day 0, the bottleneck is procedural onboarding friction. Conversely, if users complete setup successfully but drop off between Day 14 and Day 30, the issue lies in long-term retention mechanics, feature depth, or competitive substitution. Conflating pre-activation funnel drop-offs with post-activation lifecycle churn causes teams to misallocate engineering resources.
Pre-Activation vs. Post-Activation: Mapping Attrition Across the User Journey
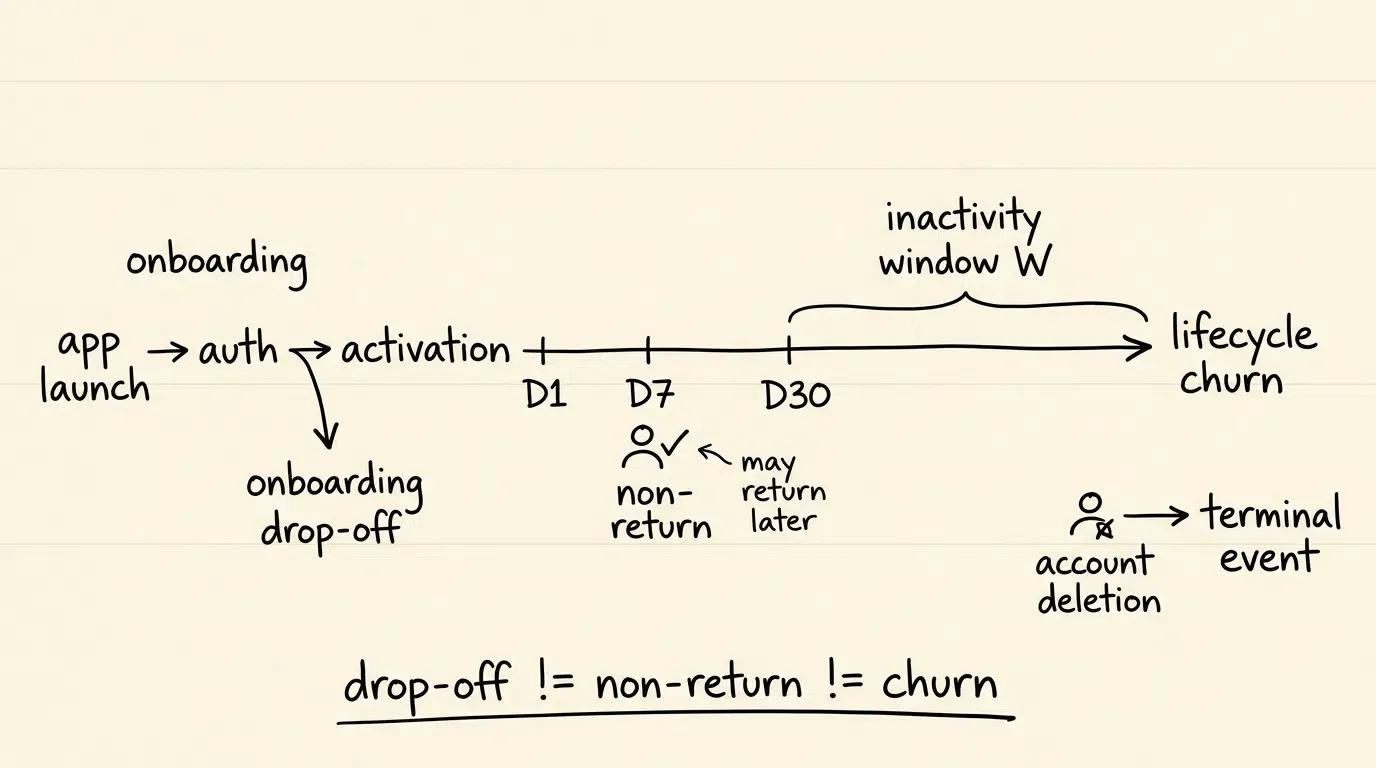
To establish an effective conversion and retention strategy, technical teams divide the user journey into two distinct operational phases:
- Pre-Activation Phase (Onboarding Funnel): Spans initial app launch through the completion of the core activation milestone (e.g., creating a workspace, linking an account, or completing a first transaction). Attrition in this phase is measured as Onboarding Drop-Off Rate, evaluating step-by-step conversion efficiency across a structured state machine.
- Post-Activation Phase (Lifecycle Retention): Begins once a user successfully completes the core activation milestone and enters the active user base. Attrition in this phase is measured as Lifecycle Churn Rate, evaluating sustained inactivity across rolling calendar windows (
) or explicit terminal events.
[User Journey Lifecycle Mapping]
┌───────────────────────────────────────────────────┬───────────────────────────────────────────────┐
│              PRE-ACTIVATION FUNNEL                │            POST-ACTIVATION LIFECYCLE            │
├───────────────────────────────────────────────────┼───────────────────────────────────────────────┤
│ App Launch ──> Permission ──> Auth ──> Activation │ D1 Return ──> D7 Return ──> D30 Active State    │
│                                                   │                                                 │
│ Metric: Onboarding Drop-Off Rate                  │ Metric: Inactivity Churn / Non-Return Share     │
│ Diagnostic Focus: Procedural & UI Friction        │ Diagnostic Focus: Ongoing Utility & Retention   │
└───────────────────────────────────────────────────┴───────────────────────────────────────────────┘
Why Treating Onboarding Drop-Off as Product Failure Leads to Ineffective Interventions
When product teams misdiagnose early onboarding abandonment as a lack of core product-market fit, they often implement structural changes to the core product—such as redesigning downstream dashboards, modifying pricing tiers, or altering core workflows. However, if new users abandon the application because a registration form required manual entry of an alphanumeric invitation code, downstream adjustments fail to resolve the root cause.
Procedural barriers prevent users from ever reaching the core value proposition. Resolving early funnel drop-off requires eliminating friction at the point of entry—streamlining identity verification, deferring non-essential permissions, and programmatically restoring acquisition context—ensuring that acquired traffic transitions into activated cohorts eligible for long-term retention analysis.
Developers seeking to integrate client telemetry and attribution SDKs can explore packages via the mobile analytics SDK package.
How to Calculate Churn Rate Across Inactivity Windows and Cohort Checkpoints
Formulating Inactivity-Defined Lifecycle Churn
In post-activation lifecycle analytics, churn is formulated on a cohort basis over a predefined inactivity window
Let
Let
The Inactivity-Defined Lifecycle Churn Rate
Inactivity-based churn is an operational classification. An inactive user is not permanently lost, as dormant users may reactivate in subsequent periods following re-engagement triggers or product updates.
Platform retention definitions may use different population rules. For example, App Store Connect retention evaluates active devices that installed the app and eventually opened it, so internal churn models should document their denominator separately rather than assuming platform and warehouse populations are identical.
Calculating Step-by-Step Onboarding Drop-Off Rates
Pre-activation onboarding efficiency is measured sequentially across the discrete steps of the setup funnel.
Let
The Onboarding Step Drop-Off Rate
Tracking step-level drop-offs allows engineering teams to isolate specific interface bottlenecks, such as authentication API timeouts, mandatory credential entry, or intrusive permission prompts.
Differentiating Day-N Non-Return from Permanent User Loss
In classic exact-day retention modeling, the complement of the Day
Where
Non-return on Day
Multi-Checkpoint Continuation and Non-Return Ratios
To evaluate whether active users at an early milestone continue their engagement through later milestones, analytics engines evaluate the checkpoint continuation ratio
Given active user subsets
The Checkpoint Non-Return Ratio is formulated as:
This metric isolates attrition occurring strictly among users who had previously demonstrated active engagement, separating ongoing lifecycle attrition from early post-install drop-off.
Mathematical Mechanics of Funnel Drop Off and Inactivity Churn Models
Comparing Attrition Metrics Across Lifecycle Stages
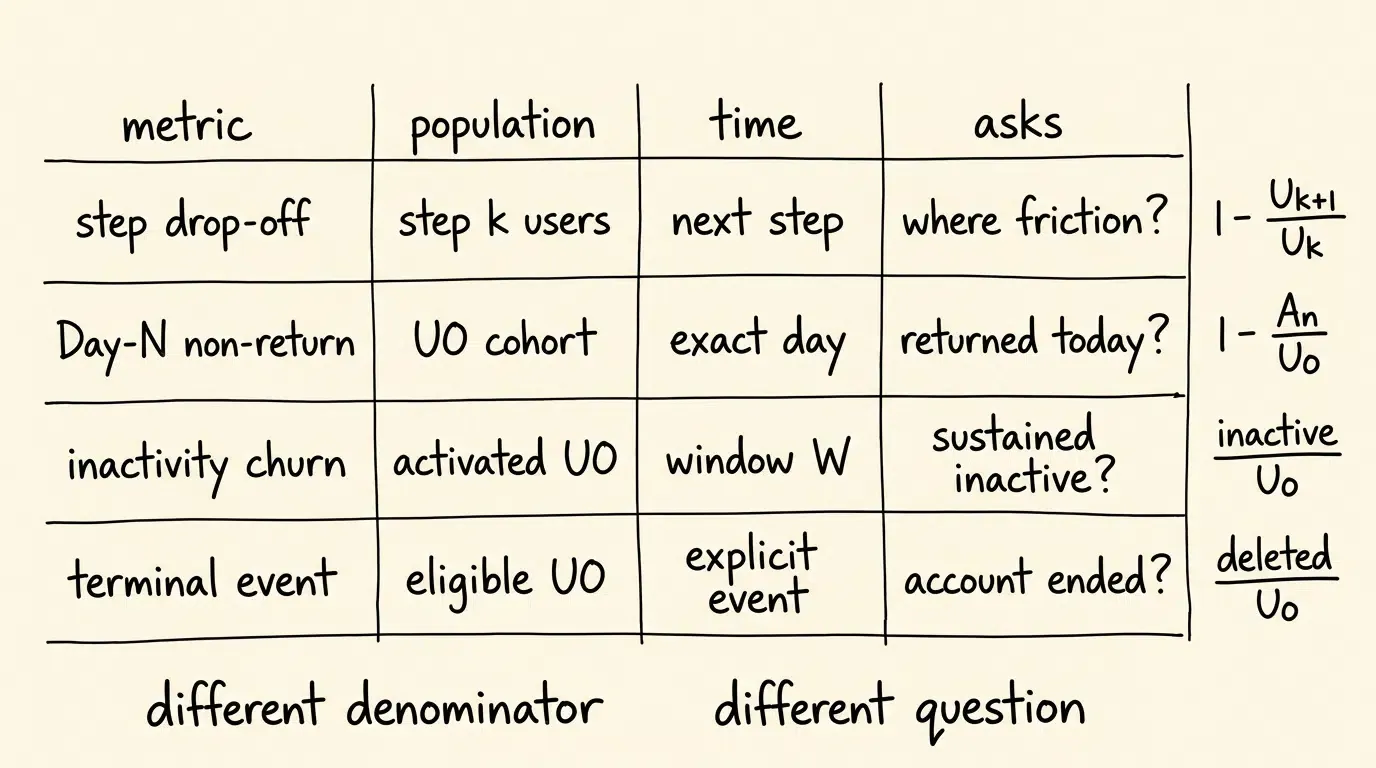
To ensure analytical rigor across product and engineering teams, mobile metrics must be categorized by evaluation stage, target population, and diagnostic scope.
The matrix below contrasts the primary funnel and lifecycle attrition metrics:
| Measurement Dimension | Calculation Formula | Evaluated User Population | Primary Diagnostic Objective |
|---|---|---|---|
| Onboarding Step Drop-Off | Users entering step |
Identifies UI and procedural friction | |
| Day-N Non-Return Share | Exact cohort on Day |
Measures exact-day return variance | |
| Inactivity Lifecycle Churn | Cohort across defined window |
Measures sustained customer attrition | |
| Terminal Account Churn | Users triggering deletion events | Measures explicit account-lifecycle termination |
How Does Parameterized Onboarding Reduce Early Conversion Friction
The Manual Input Barrier: How Promo Codes and Form Fields Inflate Step Drop-Offs
Manual data entry can introduce significant procedural friction in referral, invitation, and campaign-driven onboarding flows, particularly when users must reconstruct context after installation. Users frequently click a link on mobile web and are redirected to the app store. Upon downloading and launching the application, they encounter an unconfigured registration form requiring them to manually input an alphanumeric invitation code or search for a specific workspace ID.
Requiring manual entry introduces friction at a critical juncture. Users must leave the application, locate the referral code in an external messaging app or email, copy the string to their system clipboard, return to the application, and paste it into the form. At each transition point, context switching, memory pressure, or distraction increases the probability of session abandonment.
Contextual Data Preservation: Restoring Referral and Campaign Tokens across the Install Barrier
Parameterized onboarding mitigates this friction by programmatically preserving acquisition context across the app store installation barrier.
OpoInstall, a mobile attribution and deep linking platform, implements deferred deep linking by capturing URL query parameters (such as ?inviter_id=usr_8842&promo_code=WELCOME50) on the web landing page. When the user installs and opens the application for the first time, the native mobile SDK retrieves the cached parameters from the attribution backend.
Parameter restoration depends on the supported association mechanisms available to the implementation. On Apple platforms, the underlying workflow must comply with current App Store privacy requirements and must not derive a stable user or device identity through fingerprinting; eligible parameters should be restored only through supported, policy-compliant mechanisms.
Engineers can consult the parameter restoration documentation for technical specifications on retrieving and handling dynamic parameter payloads within native application lifecycles.
Automated Account Provisioning: Delivering Frictionless Welcome States via OpoInstall SDK
Restoring acquisition parameters upon initial launch enables applications to automate setup steps and eliminate manual form fields. When the application receives the parameter payload during initialization, it programmatically populates referral credentials, applies promotional discount tokens, and routes the user directly to the relevant workspace or content view.
The diagram below illustrates the operational flow from initial promotional click to onboarding evaluation:
[Web Promo / Referral Click] ──> [Web SDK Stages Context & Tokens]
             │                                   │
             ▼                                   ▼
   [Store Install & Open]      ──> [OpoInstall SDK Restores Context]
             │                                   │
             ▼                                   ▼
 [Auto-Populated Credentials]  ──> [Bypass Manual Form & Friction]
             │                                   │
             ▼                                   ▼
    [Day 0 Core Activation]    ──> [Compare Drop-Off vs Control]
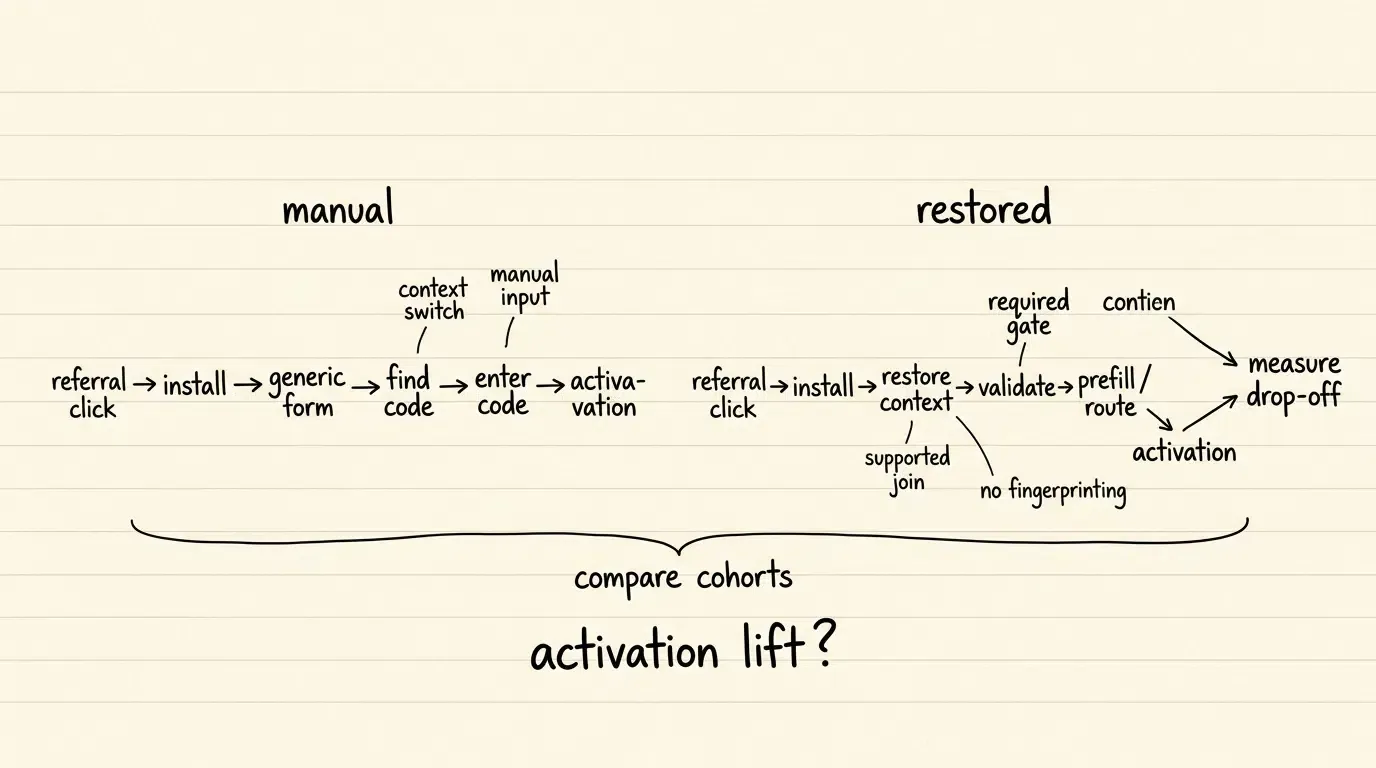
By removing manual input requirements and accelerating the transition from first open to core activation, parameterized onboarding mitigates Day 0 funnel friction, enabling growth teams to evaluate whether streamlined onboarding delivers higher activation rates compared to unassisted control cohorts.
Diagnosing Step Level Bottlenecks from App Launch to Core Activation
Instrumenting Sequential Telemetry from App Launch to First Value Milestone
To identify the specific interfaces where users abandon onboarding, analytics architectures model the setup workflow as an instrumented finite state machine. Each distinct step emits a structured telemetry event containing the step identifier, transition duration, and execution status:
- Step 1 (
onboarding_launch): Client initialization and parameter query execution. - Step 2 (
onboarding_permission_prompt): Presentation of runtime notification or tracking requests. - Step 3 (
onboarding_auth_submit): Submission of user credentials or single sign-on authentication. - Step 4 (
onboarding_profile_setup): Configuration of user preferences, organization selection, or workspace joining. - Step 5 (
onboarding_activation_complete): Execution of the primary functional value milestone.
Analyzing Transition Latency: Separating Technical Bottlenecks from User Resistance
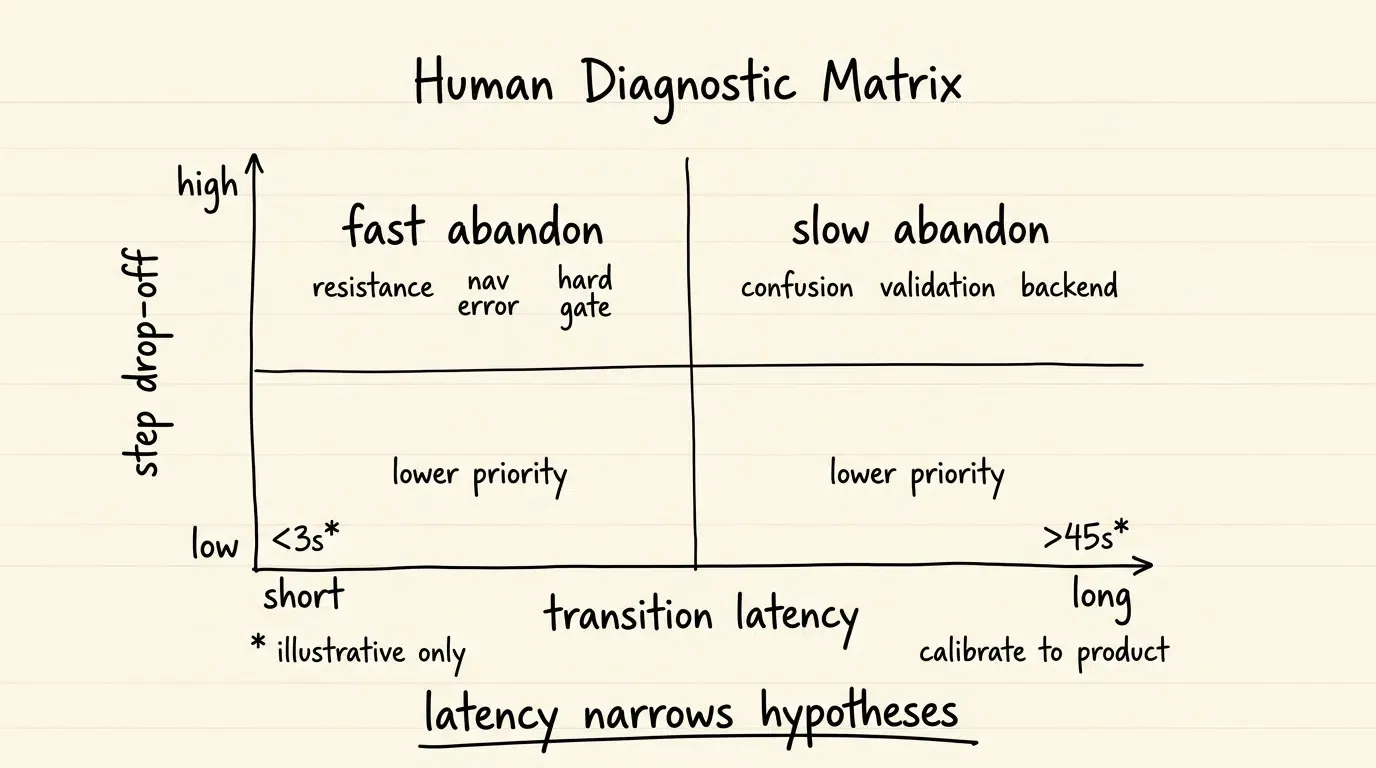
Measuring completion percentages alone provides an incomplete diagnostic picture. Telemetry pipelines must track transition latency—the elapsed time between consecutive funnel steps (
Evaluating transition latency helps separate technical failures from user friction:
- Illustrative Short-Latency Pattern (
): Users abandon the step almost immediately. This pattern often suggests immediate resistance to mandatory requirements (e.g., unexpected credit card requests or intrusive permission prompts) or client-side UI navigation errors. - Illustrative Prolonged-Latency Pattern (
): Users spend extensive time before abandoning. This pattern indicates cognitive difficulty, confusing form layouts, password validation complexity, or slow backend API response times on verification endpoints.
Thresholds should be calibrated from the product’s own latency distribution rather than treated as universal benchmarks.
Structuring Diagnostic Telemetry Payloads for Funnel Optimization
Every onboarding telemetry event should include contextual metadata properties that link step performance to device state, network conditions, and acquisition parameters.
The payload below demonstrates an illustrative production-oriented telemetry event designed for onboarding drop-off and latency analysis:
```json
{
  "schema_version": "1.2.0",
  "event_id": "evt_dropoff_9a8b7c6d-5e4f-3a2b-1c0d-8f7e6d5c4b3a",
  "event_name": "onboarding_step_telemetry",
  "client_event_timestamp_utc": "2026-08-30T14:20:10.150Z",
  "session_elapsed_monotonic_ms": 48200,
  "server_received_timestamp_utc": "2026-08-30T14:20:10.820Z",
  "user_identity": {
    "app_instance_id": "inst_anon_a1b2c3d4-e5f6-7890-abcd-ef1234567890",
    "is_first_launch": true
  },
  "funnel_telemetry": {
    "session_id": "sess_onboarding_9876543210fedcba",
    "event_sequence_index": 4,
    "step_index": 3,
    "step_name": "onboarding_auth_submit",
    "step_transition_duration_ms": 4250,
    "is_step_completed": true,
    "has_input_validation_error": false
  },
  "attribution_context": {
    "acquisition_channel": "referral_invite",
    "campaign_id": "cmp_q3_onboarding_drive",
    "channel_code": "partner_affiliate_tier1",
    "inviter_token_pseudonymous": "ref_tok_anon_77665544",
    "parameter_restoration_status": "restored_success"
  },
  "device_telemetry": {
    "platform": "Android",
    "os_version": "16.0",
    "app_version": "3.2.0",
    "sdk_version": "<installed_sdk_version>",
    "network_type": "WIFI",
    "device_tier": "mid_range"
  },
  "diagnostic_metadata": {
    "is_background_wake": false,
    "memory_pressure_state": "normal",
    "ui_render_latency_ms": 16
  }
}
When Are Automated Interventions Effective for Churn Prevention
Action-Triggered In-App Prompts vs. Premature Broadcast Messaging
Automated interventions—such as contextual tooltips, in-app guidance modals, and transactional notifications—are effective when triggered by specific user behavior rather than generic broadcast schedules. If telemetry indicates that a user stalled on Step 4 (onboarding_profile_setup) for an extended interval, an adaptive in-app tooltip can offer contextual assistance.
Conversely, dispatching generic broadcast notifications to users who have not experienced core functional value creates annoyance. Interventions must be relevant to the user’s current progress within the setup workflow.
Contextual Deep Linking: Guiding Inactive Users Directly to Incomplete Workflows
Deploying contextual deep links (Universal Links on iOS and App Links on Android) allows the application to route an authorized returning user to the relevant incomplete workflow. The application remains responsible for validating the destination and restoring any required workflow, authentication, or session state.
For example, if a user created an account on Day 0 but did not complete project setup, a re-engagement notification can route directly to the project configuration screen with pre-populated parameters.
Operating System Notification Permission Boundaries
All re-engagement communication must adhere strictly to mobile platform permission frameworks. On iOS, applications must request authorization before presenting user-facing alerts, sounds, or badges through UNUserNotificationCenter.current().requestAuthorization(options: [.alert, .badge, .sound]). On Android 13+, applications must obtain the android.permission.POST_NOTIFICATIONS runtime permission.
Furthermore, engineering teams must implement persistent opt-out state management and frequency capping. Dispatching high-frequency notifications without user consent can create notification fatigue, contributing to immediate uninstallation and elevating long-term churn.
Evaluating When to Intervene: Balancing Timely Reminders with User Fatigue
- Effective Interventions: Action-triggered setup assistance, personalized deep links returning users to incomplete forms, and automated parameter restoration upon first launch.
- Ineffective Interventions: High-frequency broadcast messaging, demanding push permissions before demonstrating value, and forcing users to complete non-essential configuration steps before accessing core features.
Frequently Asked Questions (FAQ)
What is the difference between onboarding drop-off rate and app churn rate?
Can an application prevent all user churn through onboarding optimization?
How does parameter restoration reduce registration abandonment?
Summary and Decision Framework
Effectively reducing mobile app churn requires decoupling pre-activation onboarding drop-offs from post-activation lifecycle attrition. While long-term churn reflects ongoing product-market fit and recurring utility, early drop-offs often stem from procedural friction during the initial user journey.
Diagnosing and mitigating early user loss depends on establishing structured funnel telemetry, tracking step-to-step transition latency, and removing unnecessary manual input barriers. By implementing lightweight SDK integration and contextual parameter restoration, platforms like OpoInstall provide the infrastructure required to streamline initial onboarding and support long-term user retention.
To evaluate how unified attribution and parameter-passing infrastructure can optimize your application’s onboarding funnel, explore the mobile attribution implementation reference or register on the OpoInstall developer console.
Related Materials
-
Concepts: App Churn Rate, Onboarding Drop-Off Rate, Funnel Telemetry, Parameterized Onboarding, Transition Latency
-
Technologies: Mobile App Analytics, Deferred Deep Linking, Client Lifecycle Telemetry, S2S Webhooks
-
APIs & Data Interfaces: Android
ProcessLifecycleOwner, iOSUIWindowSceneDelegate, OpoInstall SDKgetInstallParamAPI -
Official Documentation & References:
Share this article