What are the key metrics to track in game analytics? Key metrics in game analytics center on cohort retention rates across Day 1, Day 7, and Day 30, daily engagement ratios, and cumulative player Lifetime Value calculated by channel.
Game analytics is the systematic measurement, collection, and analysis of player behavioral telemetry to optimize game design, player retention, and monetization performance. By organizing players into acquisition cohorts based on install date and marketing channel, analytics frameworks separate cohort-age and acquisition-mix effects from top-line volume fluctuations, enabling accurate forecasting of player lifetime value and marketing payback periods.
| Term | Definition | Related Entity | Search Intent Role |
|---|---|---|---|
| Game Analytics | The quantitative study of player behavior, retention, and in-game economic activity. | Behavioral Telemetry | Informational / Technical |
| Cohort Analysis | The longitudinal tracking of a specific group of users sharing a common install timeframe. | Retention Matrix | Operational / Analytical |
| Retention Rate | The percentage of acquired players who return to the game on a specific day post-install. | N-Day Retention | Informational / Commercial |
The Hierarchy of Core Metric in Mobile Game Analytics
The Four Pillars of Game Telemetry: Acquisition, Engagement, Retention, and Monetization
A resilient game analytics framework organizes complex player telemetry into four functional pillars: Acquisition, Engagement, Retention, and Monetization. Rather than tracking hundreds of disconnected metrics, engineering and analytics teams maintain a unified measurement hierarchy that traces player lifecycles from initial touchpoint to long-term monetization.
- Acquisition Metrics: Measure the velocity, cost, and source of incoming players, including Cost-Per-Install (CPI), Customer Acquisition Cost (CAC), and channel attribution mix.
- Engagement Metrics: Track how actively players interact with game systems, evaluating Daily Active Users (DAU), Monthly Active Users (MAU), average daily session duration, and daily session frequency.
- Retention Metrics: Quantify the percentage of an acquired player cohort that returns to the game across specific post-install time intervals, identifying onboarding cliffs and long-term loyalty.
- Monetization Metrics: Evaluate revenue generation across In-App Purchases (IAP) and In-App Advertising (IAA), tracking Average Revenue Per Daily Active User (ARPDAU), Average Revenue Per Paying User (ARPPU), conversion rates, and cumulative Lifetime Value (LTV).
Engagement Health: Measuring Daily Active Users, Monthly Active Users, and the Stickiness Ratio
Top-line volume indicators such as DAU and MAU provide broad measures of scale but reveal little about engagement quality. A title experiencing rapid user acquisition can show growing DAU even as underlying player retention deteriorates.
To evaluate genuine engagement health, analytics teams calculate the Stickiness Ratio:
The stickiness ratio measures the frequency with which monthly active users return on a daily basis. For example, a game with 100,000 MAU and 20,000 DAU maintains a stickiness ratio of 20%, roughly equivalent to about six active days per monthly active user under a stable 30-day approximation. In competitive mobile gaming, stickiness varies by genre and play loop design; studios should benchmark their ratio against peer titles within their specific category and lifecycle stage rather than adopting an arbitrary target.
The Fallacy of Aggregate Reporting: Why Blended Metrics Mask Underlying Channel Decay
A primary error in mobile game business intelligence is relying on aggregate, blended metrics. When studios evaluate blended retention or portfolio-level ARPDAU, underperforming paid channels are masked by high-retention organic traffic or viral word-of-mouth users.
Illustrative scenario: An aggregate Day 1 retention rate of 35% may appear healthy. However, disaggregating the data by acquisition channel often reveals that organic search users retain at 48%, while users acquired from a programmatic display campaign retain at only 14%. Evaluating blended averages creates false confidence, concealing unprofitable media spend and preventing game teams from identifying specific channel-level onboarding bottlenecks.
How Does Cohort Analysis Measure True Player Retention Decay
Defining the Acquisition Cohort: Segmenting Players by Install Date, App Version, and Media Channel
Cohort analysis groups players who share a common temporal starting point, tracking their behavioral and commercial metrics longitudinally over time. In mobile gaming, the baseline acquisition cohort comprises users who installed and launched the application for the first time during a specific operational time window.
To extract actionable operational insights, acquisition cohorts must be sliced along multiple dimensions:
- Temporal Boundary: The calendar date or week of first launch (
). - App Build and Content Version: Slicing cohorts by client binary version isolates the impact of game balance adjustments, tutorial redesigns, and live-ops events.
- Attribution Source: Isolating cohorts by media channel, partner network, campaign identifier, and geographic market.
The Mechanics of the Retention Matrix: Reading Triangular Cohort Grids Across Time Horizons
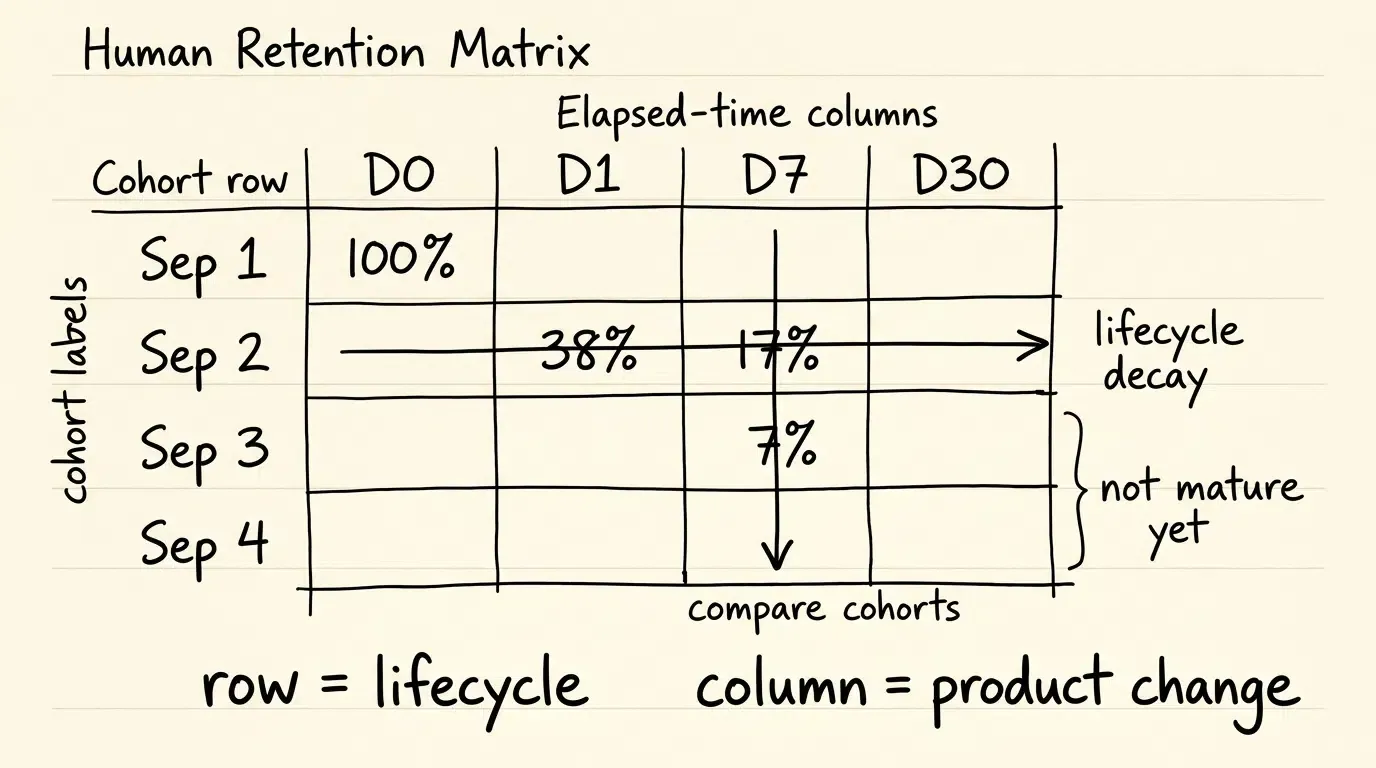
The foundational artifact of retention analysis is the triangular cohort matrix grid. In this structure, each row represents an acquisition cohort (e.g., installs on September 1), columns represent elapsed days post-install (
Reading the matrix provides two distinct analytical vectors:
- Horizontal Analysis (Lifecycle Trajectory): Reading across a single row tracks how a specific cohort decays over time, revealing whether retention stabilizes into a flat tail or continues to decay toward zero.
- Vertical Analysis (Macro Product Evolution): Reading down a single column (e.g., comparing Day 1 retention across consecutive cohorts over 30 days) isolates the impact of product updates, server stability improvements, or seasonal shifts while controlling for cohort age.
Identifying Early Progression Cliffs and Churn Inflection Points
A primary operational function of cohort retention tracking is identifying progression cliffs—points in the game design where player drop-off accelerates abnormally.
By cross-referencing cohort retention grids with in-game progression milestones (such as level completion, tutorial steps, or boss encounters), analytics teams pinpoint mechanical friction points. A steep drop between Day 1 and Day 2 often warrants investigation into onboarding confusion or early difficulty tuning, whereas a sharp drop between Day 7 and Day 14 may indicate content exhaustion or progression roadblocks.
Differentiating Between Organic Baseline Cohorts and Paid User Acquisition Influxes
Retention often differs materially by acquisition source; organic traffic can provide a useful comparison cohort, but no source should be assumed superior without empirical validation. Organic cohorts—driven by active intent, direct search, or peer recommendations—frequently demonstrate higher baseline engagement and slower retention decay.
Conversely, paid acquisition cohorts reflect varied intent levels depending on ad format and creative targeting. High-intent search users often mirror organic curves, while users acquired via rewarded networks may churn rapidly once initial incentives are fulfilled. Tracking paid and organic cohorts independently prevents sudden marketing spend scaling from distorting underlying product retention metrics.
Mathematical Formulations for Classical and Rolling Retention Rates
Classical N-Day Retention: Measuring Specific-Day App Launch Behavior
This reference architecture defines Day
Classical retention (also known as strict N-day retention) measures the exact proportion of an install cohort that launches the game during that specific 24-hour elapsed window on Day
Mathematically, Classical Retention for Day
Where:
represents the total number of unique players in the cohort who completed their first app launch on Day 0. represents the count of unique players from who logged at least one active session during the specific Day elapsed interval.
Platform dashboards (such as Apple App Store Connect) may enforce distinct opt-in, diagnostic sharing, or calendar-day bucketing rules, meaning platform-reported retention figures should not be assumed to match first-party warehouse numbers identically. Classical retention is widely utilized for financial modeling and live-ops scheduling because it measures daily active presence.
Rolling Retention: Measuring Activity on Day N or Any Day Thereafter
Rolling retention (also termed unbounded or return retention) measures the percentage of an install cohort that returns to the game on Day
Mathematically, Rolling Retention for Day
Where:
represents the count of unique players from initial cohort who logged an active session on Day or any day after Day .
Rolling retention requires an adequate observation horizon. A Day
Bracketed Retention: Evaluating Engagement Across Multi-Day Time Windows
To smooth out day-of-week seasonality (such as weekend engagement spikes versus weekday drops), analytics frameworks employ bracketed retention.
Bracketed retention defines engagement across custom multi-day intervals:
- Bracket 1 (Day 1 to Day 3): Initial onboarding and early progression adoption.
- Bracket 2 (Day 4 to Day 7): Core gameplay loop engagement.
- Bracket 3 (Day 8 to Day 14): Mid-game transition.
- Bracket 4 (Day 15 to Day 30): Long-term retention baseline.
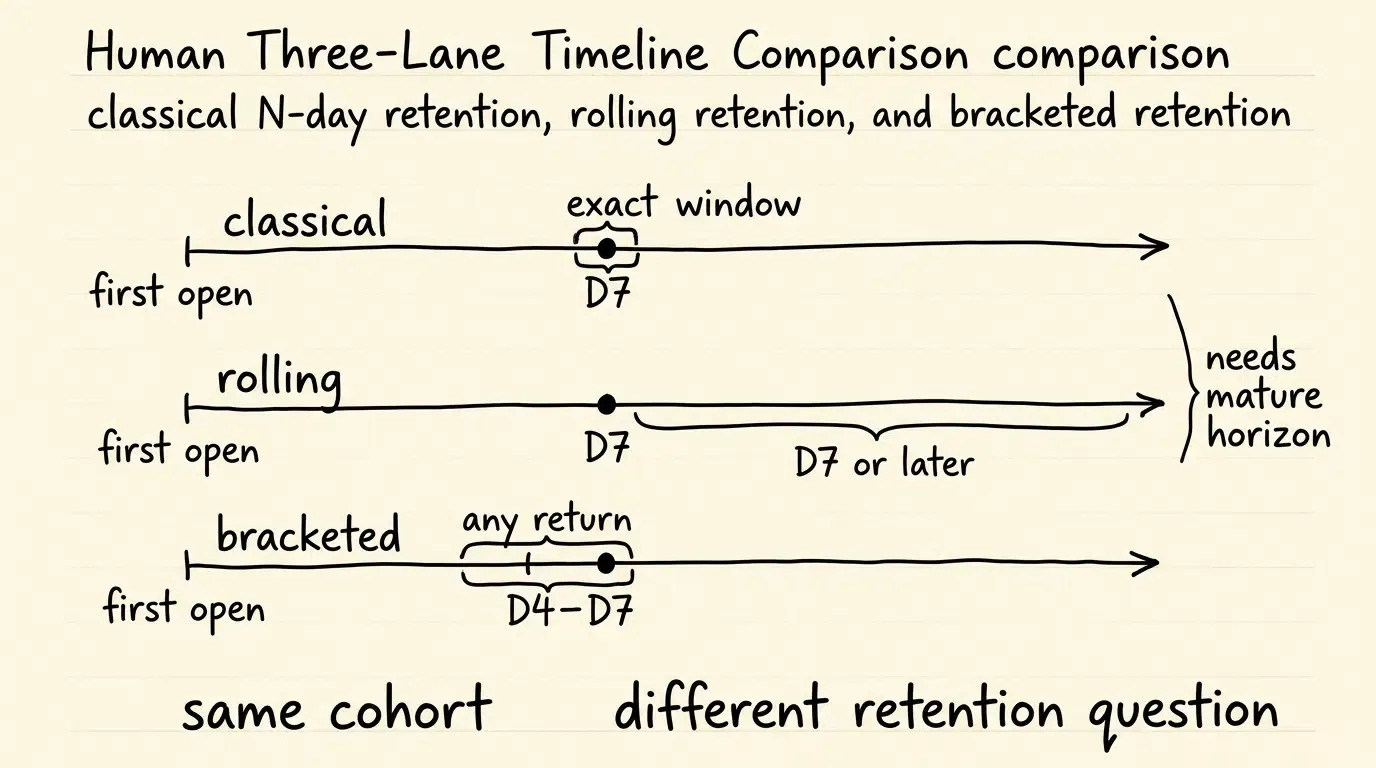
A user is counted as retained within a bracket if they complete at least one active session at any point during that specific multi-day interval.
Comparative Evaluation: Selecting the Appropriate Retention Formula by Game Genre
Selecting the appropriate retention metric depends on game mechanics and session frequency expectations:
| Game Vertical | Primary Retention Metric | Rationale |
|---|---|---|
| Mid-Core RPG / Strategy | Classical N-Day ( |
Requires daily check-ins, energy cycles, and synchronized guild events. |
| Casual / Match-3 Puzzle | Bracketed / Rolling Retention | Accommodates episodic, non-daily play habits without penalizing gaps. |
| Hyper-Casual | Classical Strict ( |
Short lifecycles require immediate measurement of daily ad exposure. |
| Social / Party Multiplayer | Classical N-Day + Rolling |
Balances immediate matchmaking density with long-term viral return. |
How to Calculate Cumulative Player Lifetime Value Across Longitudinal Cohorts
The Cumulative Cohort LTV Formula: Discrete Summation Across Time Horizons
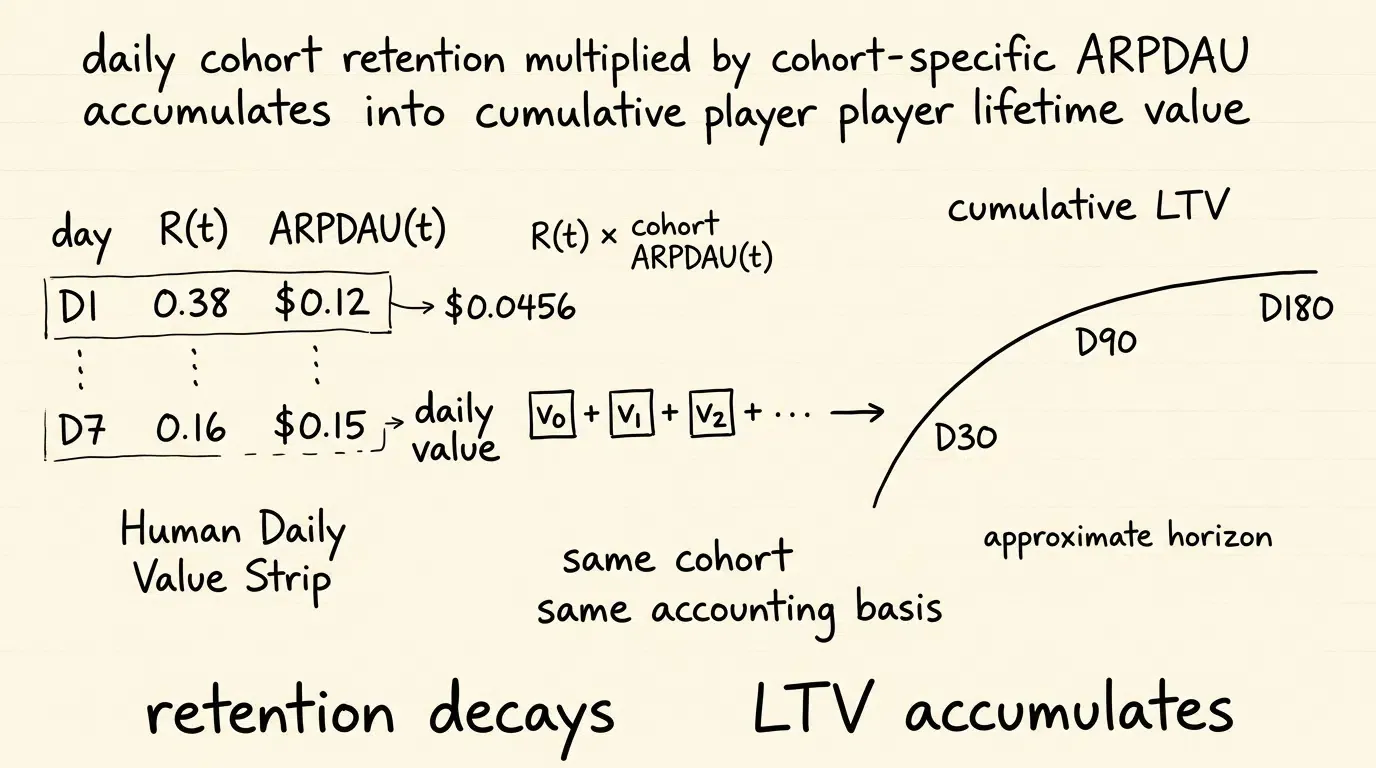
Player Lifetime Value (LTV) represents the cumulative net revenue generated by an average acquired player in an acquisition cohort from Day 0 through time horizon
The cumulative cohort LTV formula is expressed as:
Where:
represents the time horizon evaluated (e.g., Day 30, Day 90, Day 180). represents the classical cohort retention rate on elapsed day post-install. represents the average net revenue generated on elapsed day by active users belonging to the same acquisition cohort used to calculate . Portfolio-wide or blended ARPDAU must not be substituted into a channel-specific cohort LTV calculation.
Reconciling In-App Purchases and Programmatic Ad Revenue on a Unified Accounting Basis
In modern hybrid-monetized titles, daily revenue comprises both direct microtransactions and programmatic ad yield:
All monetization telemetry in this model must use a consistent accounting basis. Studios should avoid mixing gross consumer purchase amounts (which include app store commissions and local taxes) with net advertising yields. Telemetry feeding LTV calculations must be standardized to net realized proceeds post-deduction of platform commissions, refunds, and mediation adjustments.
Mathematical Curve Fitting for Long-Term Projections: Shifted Power Law versus Logarithmic Models
In soft-launch testing, studios cannot wait 180 days of live operations to observe mature Day 180 LTV. Data science teams fit early retention and monetization curves (such as Days 0 through 30) to mathematical projection models.
To avoid mathematical singularities at Day 0 (
- Shifted Power Law Model: Formulated as
, where and are empirical parameters. This function reflects the property that player churn rates often moderate as tenure increases. - Shifted Logarithmic Model: Formulated as
, used primarily for short-horizon projections where retention decays rapidly. Predicted retention must be constrained to the valid probability range , and logarithmic forms should not be extrapolated beyond their validated horizon.
Candidate projection models should be selected and validated through out-of-sample backtesting against mature historical cohorts rather than relying on in-sample curve fitting alone.
Calculating ROAS and Payback Horizons Across Channel-Specific Cohorts
Return on Ad Spend (ROAS) evaluates commercial payback velocity across channel cohorts over time horizon
Both
Longitudinal Cohort Retention and Cumulative LTV Decay Curve:
 Retention Rate % Cumulative Net LTV ($)
| |
100%| [Day 0: Install Baseline] | .--- LTV(180) Projection
| \ | .---'
40%| \ [Day 1: Onboarding Health] | .---'
| \ | .---' LTV(30)
20%| \ [Day 7: Core Loop Retention] |/
| \________________________ | [Day 0: Initial Spend]
10%| \ [Day 30 Baseline] |
+--------------------------------------------------------+--------------------->
D0 D1 D7 D30 D0 D30 D90 D180 (Days)
|◄──────── Retention Decay Curve ────────────────────►|◄─── Cumulative LTV ──►|

Technical Framework for Raw Telemetry Ingestion and Cohort Analysis
Structuring Event Instrumentation: Session Starts, Progression Milestones, and Revenue Events
Establishing a reliable cohort analytics pipeline requires standardized event instrumentation within the game client. Every player session dispatches structured event telemetry capturing exact lifecycle milestones.
Core event types include:
session_start: Dispatched upon app launch and foreground transitions, logging session sequence, app version, local occurrence time, and server receipt time.progression_milestone: Logs tutorial completion, stage clears, and narrative checkpoints, enabling progression cliff analysis.monetization_event: Dispatches verified IAP transaction tokens and impression-level ad revenue (ILRD) callbacks.
Teams seeking technical specifications for event logging structures and data warehouse integration can consult current raw data export documentation for payload formats and ingestion guidelines.
The Role of Attribution Tracking Parameters in Eliminating Channel Blindness
Client-side telemetry events must carry attribution context to enable cross-channel cohort slicing. When an application launches for the first time, the attribution SDK captures the install parameters—such as partner network, campaign identifier, creative theme, and ad placement ID—and associates them with the internal player account identifier.
By stamping subsequent event logs with attribution metadata, data engineering pipelines group players into clean acquisition cohorts in the centralized data warehouse without requiring manual post-processing.
For engineering teams evaluating SDK integration controls and telemetry collection modules, consult the SDK integration resources for implementation guidelines.
Structuring the Player Cohort Analytics and Telemetry Schema
To support longitudinal cohort tracking across distributed analytics systems, data pipelines enforce structured JSON schemas.
The schema placeholder below illustrates an empirical cohort-level analytics record capturing acquisition channel context, retention observation states, realized revenue streams, and projected LTV metrics:
{
  "reference_architecture": true,
  "illustrative_values": true,
  "cohort_analytics_record": {
    "cohort_identity": {
      "cohort_id": "cht_2026-08-15_partner_video_us",
      "cohort_entry_definition": "first_open",
      "retention_window_definition": "elapsed_24_hour",
      "cohort_size": 12540
    },
    "attribution_context": {
      "acquisition_channel": "partner_ad_network_video",
      "campaign_id": "cmp_hero_launch_us",
      "country_iso": "USA"
    },
    "observation_state": {
      "observation_through_day": 45,
      "day_30_classical_mature": true,
      "day_30_rolling_mature": false
    },
    "retention_metrics": {
      "day_1_classical": 0.31,
      "day_7_classical": 0.11,
      "day_30_classical": 0.047
    },
    "revenue_metrics": {
      "accounting_basis": "net_realized_revenue",
      "day_30_revenue_per_acquired_user_usd": 2.18
    },
    "ltv_forecast": {
      "as_of_day": 30,
      "forecast_horizon_days": 180,
      "model_version": "cohort_ltv_v3",
      "predicted_ltv_180_usd": 5.64,
      "prediction_interval": {
        "confidence_level": 0.90,
        "lower_usd": "<model_output>",
        "upper_usd": "<model_output>"
      }
    },
    "channel_economics": {
      "channel_cpi_usd": 1.80,
      "day_30_roas": 1.21,
      "projected_payback_day": 24,
      "payback_estimation_source": "cohort_ltv_v3",
      "payback_status": "projected_profitable"
    }
  }
}
Normalizing Server-Authoritative Timestamps and Resolving Cross-Timezone Discrepancies
A persistent source of data corruption in game analytics is timezone fragmentation. Players install and play across global timezones. If an analytics engine calculates Day 1 retention using device-local calendar dates, a user installing at 11:45 PM and launching the app again at 12:15 AM local time is erroneously recorded as retained on Day 1, despite having engaged for only 30 continuous minutes.
To eliminate timezone distortion, cohort pipelines enforce strict operational standards:
- Dual Timestamp Logging: Ingest both
event_occurred_at_utc(device-reported occurrence time) andserver_received_at_utc(authoritative edge timestamp) to identify offline buffering and late arrivals. - Elapsed-Time Windowing: This reference architecture uses the player’s first successful app open as the retention origin. Day
spans from up to, but not including, . This definition must remain consistent across cohort assignment, retention computation, LTV aggregation, and downstream reporting. - Late-Arrival Recomputation Policies: Cohort aggregates should define a late-arrival watermark or recomputation policy so delayed events cannot silently alter historical retention figures after reports are finalized.
Comparative Analysis of Core Metrics Across Game Genres
Analyzing Baseline Retention Profiles and Monetization Horizons Across Major Mobile Verticals
Optimal metric thresholds vary widely across game genres. Attempting to evaluate a casual puzzle game using the metrics of a 4X strategy game leads to flawed product decisions.
The table below outlines the core retention patterns, illustrative monetization horizons, and focus metrics that studios monitor across major mobile gaming verticals:
| Game Genre | Retention Pattern to Monitor | Illustrative Monetization Horizon | Core Optimization Metric |
|---|---|---|---|
| Hyper-Casual | Early-session decay sensitivity | Short (Early sessions via IAA) | Day 1 Retention, Ad Impressions Per Active User |
| Casual / Puzzle | Mid-horizon level progression cliffs | Medium (Mid-lifecycle via Hybrid) | Day 7 Retention, Blended ARPDAU |
| Mid-Core / RPG | Long-tail active player survival | Long (Extended lifecycle via IAP) | Day 30 Retention, Payer Conversion Rate |
| 4X Strategy / Hardcore | Sustained long-run cohort economics | Extended (Long-tail lifecycle via IAP) | Whale Retention, Payback Horizon |
Evaluating Genre-Specific Benchmarks and Payback Cycle Expectations
In hyper-casual gaming, early retention is critical because monetization is often concentrated in early player sessions through programmatic advertising. If early retention decays prematurely, the title cannot generate sufficient impression density to cover acquisition costs.
In contrast, 4X strategy titles operate on extended payback cycles. These games often exhibit moderate early retention due to complex onboarding systems and deep mechanics. However, retained cohorts display high long-term retention tails and substantial microtransaction spending. Studios operating in hardcore verticals evaluate Day 90 and Day 180 cohort LTV curves, allocating acquisition budgets based on long-tail payback projections rather than immediate early monetization.
When Should Game Studios Prioritize Retention Over Early Monetization
Conditions Warranting an Exclusive Focus on Retention Optimization
Game development teams should focus exclusively on optimizing retention metrics under specific production conditions:
- Soft-Launch Validation: During early regional soft launches, testing should evaluate whether the core gameplay loop achieves baseline retention thresholds before introducing aggressive monetization systems.
- Steep Early Progression Cliffs: When cohort telemetry reveals severe drop-offs between Day 0 and Day 3, indicating tutorial friction, confusing UI navigation, or early balance imbalance.
- Negative Marketing Payback: When marketing acquisition costs exceed cumulative Day 30 LTV curves, scaling ad spend will accelerate capital depletion; retention must be repaired before resuming user acquisition.
Conditions Permitting Monetization Layer Expansion
Transitioning engineering resources toward monetization optimization is justified once baseline engagement stabilizes:
- Stable Long-Tail Retention Curves: When longitudinal cohort grids demonstrate that retention curves flatten into a stable, predictable tail from Day 14 through Day 30.
- Healthy Session Frequency: When active players exhibit consistent daily session counts and steady engagement stickiness relative to genre peers.
- Predictable Economy Sinks: When the game economy features well-calibrated virtual currency sinks and progression gates capable of absorbing monetization features without breaking game balance.
Common Misconceptions in Game Analytics Strategy
- Misconception 1: Aggregate Blended Metrics Reflect True Channel Health: Evaluating marketing ROI using portfolio-level blended LTV masks low-quality, unprofitable paid acquisition channels behind high-performing organic traffic.
- Misconception 2: All Day 1 Return Visits Represent Equal Value: Tracking simple binary app launches ignores engagement depth; a player who launches the game for 10 seconds before closing it reflects onboarding friction rather than healthy adoption.
- Misconception 3: Aggressive Early Monetization Can Compensate for Churn: Introducing aggressive paywalls or unskippable ads during early sessions may boost short-term revenue but severely accelerates long-term cohort attrition, depressing cumulative 180-day LTV.
Frequently Asked Questions (FAQ)
What are the most critical metrics in mobile game analytics?
How does classical retention differ from rolling retention in mobile games?
Why is channel-level attribution essential for accurate cohort analysis?
Summary and Decision Framework
Establishing an authoritative game analytics framework requires shifting from vanity aggregate metrics toward granular, attribution-driven cohort analysis. Accurately assessing commercial viability relies on measuring longitudinal retention decay, calculating cumulative LTV using consistent accounting baselines, and evaluating channel performance independently.
By disaggregating player telemetry by acquisition source and standardizing event instrumentation, game studios can identify progression bottlenecks, optimize marketing spend toward profitable cohorts, and ensure long-term commercial sustainability.
To explore how raw data exports and attribution tracking can power granular cohort analysis in your title, consult the mobile attribution implementation reference.
Related Materials
-
Concepts: Game Analytics, Cohort Analysis, User Retention, N-Day Retention, Rolling Retention, ARPDAU, Player LTV
-
Technologies: Attribution SDK, Raw Data Pipelines, Event Ingestion Gateways, Telemetry Warehouses
-
Standards: IETF RFC 3339 Timestamp and Date Formats, W3C Navigation and Performance Timing, OWASP Mobile Security Guidance
-
APIs: Apple Analytics Reports API, Channel Statistics Interfaces
-
Official Documentation & References:
Share this article