How does mobile app analytics help in user retention? Mobile app analytics tracks user retention by grouping users into structured acquisition cohorts, logging return milestones against explicit active-state criteria, and modeling empirical retention decay curves to isolate churn drivers.
Mobile app analytics refers to the systematic telemetry, aggregation, and mathematical modeling of post-installation user behavioral data across native mobile applications. Applied to lifecycle measurement, it tracks longitudinal engagement milestones, evaluates cohort decay over defined lookback windows (
), and identifies behavioral thresholds that predict durable user retention versus structural churn.
| Term | Definition | Related Entity | Search Intent Role |
|---|---|---|---|
| Mobile App Analytics | The systematic measurement of in-app user interactions and lifecycle retention. | App Analytics | Informational / Commercial |
| Cohort Analysis | Grouping users by a shared temporal or acquisition attribute to measure behavior over time. | Retention Rate | Informational |
| Retention Rate | The percentage of an acquired cohort that remains active at a designated interval. | Churn Rate | Technical / Informational |
Why Mobile App Analytics Is Essential for Measuring User Retention
The Role and Scope of Store-Console Retention Metrics
Platform consoles such as App Store Connect provide valuable platform-level cohort analytics, tracking active device returns across broad acquisition dates, store sources, and regional benchmarks. However, store-console retention metrics rely on platform-defined semantic assumptions that may not align with an organization’s internal business logic.
Store platforms define active status and cohort entry based on operating system interactions. When product teams require business-specific activation definitions (such as completing an onboarding tutorial or executing an initial transaction), custom in-app analytics becomes necessary. Dedicated mobile telemetry allows organizations to define custom session boundaries, join external marketing parameters, and export raw event data to internal data warehouses for multi-dimensional segmentation.
The table below contrasts common cohort baseline models:
| Retention Model Layer | Cohort Anchor Event ( |
Measured Unit of Analysis | Primary Analytical Focus |
|---|---|---|---|
| Example: App Store Connect App Retention | Installation date (denominator includes active devices that installed and opened the app) | Active physical device | Platform-level ecosystem engagement |
| Custom Activation Telemetry | Completion of primary onboarding milestone | Pseudonymous account or app instance | Core feature adoption and product utility |
| Subscription Lifecycle | Start of trial or paid subscription term | Billed subscriber profile | Recurring monetization and renewal health |
Defining Active User Status: Distinguishing Meaningful Sessions from Passive App Launches
A foundational requirement in retention modeling is establishing an explicit, technically verifiable definition of an active session. Treating any application launch as an active engagement event introduces measurement distortion. Operating system pre-warming, automated background synchronization tasks, and brief accidental opens dismissed within seconds can register as active launches in unrefined pipelines.
Mobile app analytics frameworks establish explicit active-state criteria based on verified in-app engagement:
- Session Duration Thresholds: Sustained foreground engagement meeting an illustrative product-defined threshold (e.g.,
of continuous foreground execution). - Execution of Qualifying Events: Verification that a user triggered a meaningful functional event (e.g., executing a database query, streaming an audio track, or submitting a form).
- Foreground State Verification: Explicit confirmation that the application transitioned to an interactive UI state (
onActivityResumedon Android orsceneDidBecomeActiveon iOS) rather than executing background processing.
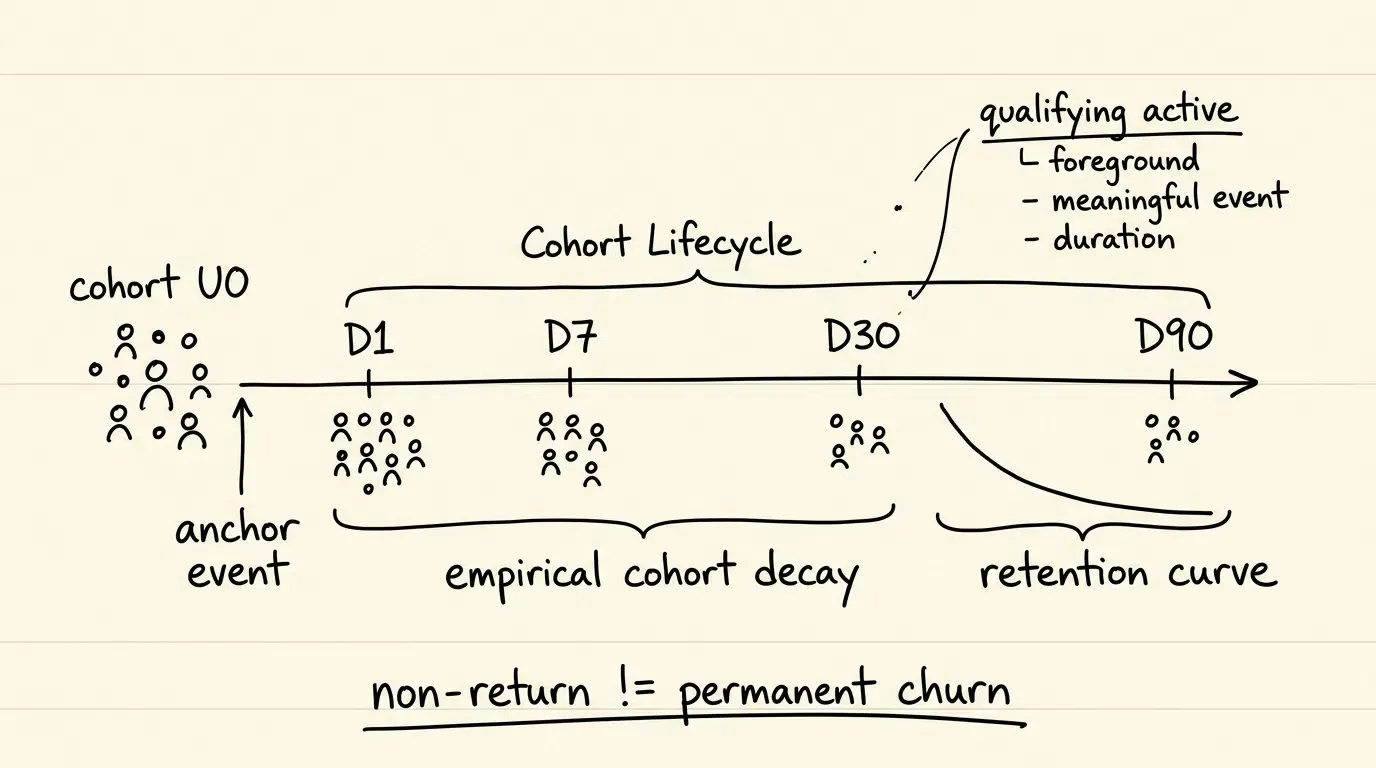
Filtering out background wakes and transient launches ensures that calculated retention metrics reflect product-defined qualifying engagement rather than background lifecycle noise.
Defining Lifecycle Churn and Non-Return Metrics
In lifecycle analytics, retention and churn must be formulated with mathematical precision to prevent taxonomic confusion. In classic exact-day measurement, the complement of the Day
To evaluate user attrition accurately, analytics teams distinguish between two separate measurement concepts:
- Checkpoint Non-Return Rate: The proportion of users active at milestone
who fail to log an active session at milestone , defined as where . - Inactivity-Defined Lifecycle Churn: The sustained absence of qualifying activity over an extended observation window (e.g., zero active sessions recorded across 30 consecutive days), or an explicit terminal event such as account closure.
Separating single-day non-return metrics from sustained lifecycle churn prevents organizations from misinterpreting periodic usage fluctuations as permanent customer loss.
How to Formulate Retention Rate and Churn Decay Models
Mathematical Definition of Classic N-Day Retention
Classic N-Day retention measures the proportion of users from a baseline cohort who return and engage on precisely the
Let
Where
Let
Where
The Classic N-Day Retention Rate
In this strict formulation, active status is evaluated strictly on Day
Empirical Decay Modeling: Comparing Exponential, Power-Law, and Plateau-Adjusted Functions
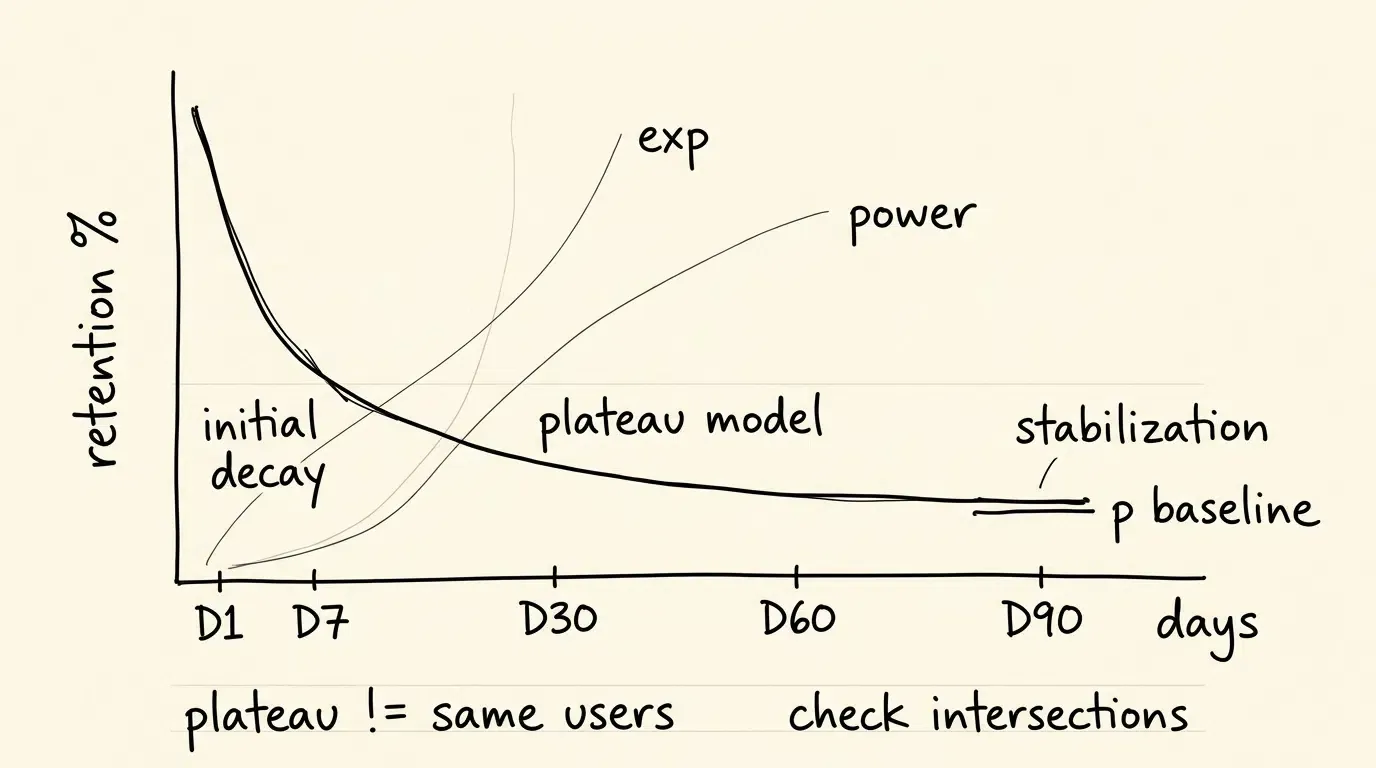
Long-term cohort retention curves exhibit non-linear decay over time. Rather than assuming a single universal mathematical family governs all applications, analytics teams evaluate candidate decay models against observed cohort data.
Example candidate formulations include:
- Exponential Decay Model: Assumes a constant proportional rate of user loss over time:
- Standard Power-Law Model: Models decreasing marginal churn as user tenure increases across post-baseline lifecycle days (
), though mathematically decaying toward zero as :
- Plateau-Adjusted Power-Law Model: Incorporates a positive constant
representing the fitted asymptotic retention baseline:
Under the plateau-adjusted formulation, as
When retention is represented as a proportion, fitted parameters are mathematically constrained such that
Quantifying Checkpoint Continuation and Non-Return Shares
To evaluate cohort progression between specific lifecycle checkpoints (e.g., assessing how Day 7 active users persist through Day 30), analytics engines measure continuation ratios.
The continuation ratio
The corresponding checkpoint non-return share is:
Analyzing checkpoint continuation enables teams to determine whether retention drop-offs occur primarily during early lifecycle retention (Days 1–7) or during mid-lifecycle adoption (Days 7–30).
Identifying Long-Term Retention Stabilization
A sustained positive plateau in an empirical retention curve indicates that the cohort-level exact-day retention rate has stabilized over the observed horizon.
Mathematically, stabilization occurs when the first derivative of the fitted retention function approaches zero while the retention value remains strictly positive:
Observing a stable retention rate does not by itself prove that the exact same individuals remain active across every consecutive measurement checkpoint. Cohort-level stabilization measures aggregate population persistence; establishing persistent user-level continuity requires intersection, survival, or multi-checkpoint continuation analyses (
Mathematical Distinctions Across Primary Retention Methodologies
N-Day Retention: Strict Exact-Day Return Measurement
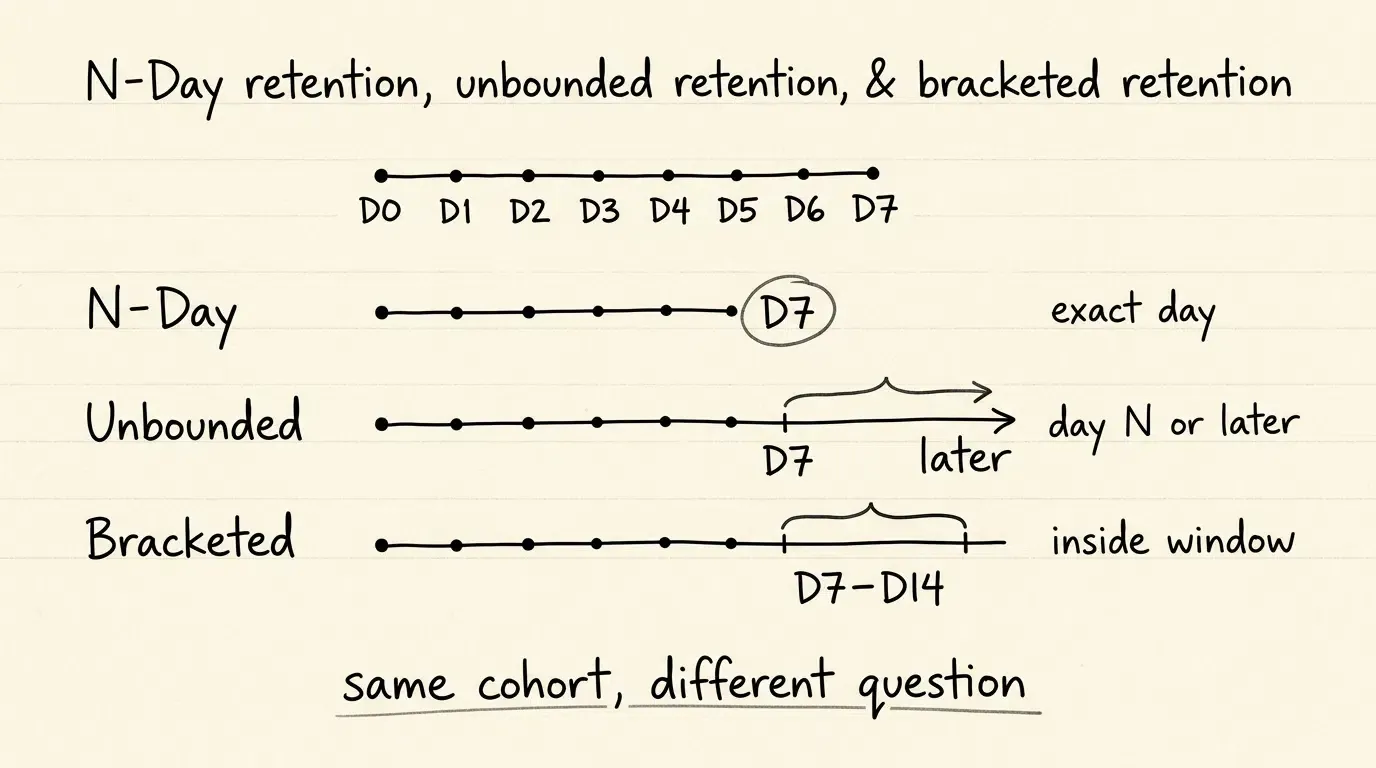
N-Day retention evaluates engagement on specific calendar intervals relative to Day 0. It answers the question: What percentage of the initial cohort was active on exactly Day N?
- Common Use Cases: High-frequency communication platforms, casual mobile games, social media feeds, and daily utility applications.
- Inherent Analytical Bias: Sensitive to calendar-day anomalies and day-of-week seasonality (e.g., evaluating Day 6 for a business application when Day 6 falls on a weekend).
Unbounded Retention: Measuring Return Activity on or After a Specific Day
Unbounded retention (also called rolling retention) evaluates whether a user returned on a designated day or any subsequent day within the observation window. It answers the question: What percentage of the initial cohort remained active on Day N or later?
Given an observation cutoff
Unbounded Retention
- Common Use Cases: E-commerce platforms, travel booking applications, real estate search tools, and seasonal services.
- Inherent Analytical Bias: Subject to right-censoring; historical retention metrics update retroactively as dormant users return at later dates.
Bracketed Retention: Evaluating Usage Across Custom Operational Bins
Bracketed retention evaluates whether a user logged at least one qualifying session within a defined multi-day window, smoothing out daily fluctuations.
Given a time bracket
The Bracketed Retention Rate
The table below summarizes the characteristics of these primary retention models:
| Retention Metric Type | Calculation Formula | Common Use Cases | Inherent Analytical Bias |
|---|---|---|---|
| N-Day (Classic) | Daily utilities, social platforms, mobile games | Penalizes irregular but active usage patterns | |
| Unbounded (Rolling) | E-commerce, travel booking, episodic tools | Retroactively increases as dormant users return | |
| Bracketed (Window) | B2B SaaS, productivity suites, fintech apps | Masks multi-day dormancy within the active bracket |
How Does Cohort Analysis Isolate High Retention Acquisition Channels
Acquisition-Time Cohorts vs Behavioral Cohorts
Mobile analytics frameworks employ two primary cohort dimensions to evaluate retention drivers:
- Acquisition Cohorts: Grouping users based on external acquisition properties, such as install date, marketing channel code, ad creative variant, or regional origin.
- Behavioral Cohorts: Grouping users based on specific in-app milestones completed within a defined initial window (e.g., users who enabled biometric authentication on Day 0 vs. users who skipped).
Cross-tabulating acquisition cohorts with behavioral cohorts allows growth teams to determine whether variations in retention stem from traffic source quality or post-install onboarding paths.
Joining Pre-Install Marketing Attribution Parameters with Long-Term Retention Logs
Measuring channel-level retention requires linking pre-install attribution metadata with ongoing behavioral event streams.
OpoInstall, a mobile attribution and deep linking platform, captures acquisition context (including campaign identifiers, channel codes, and dynamic referral parameters) during initial web-to-app routing. Upon application activation, these metadata tokens are bound to the client instance.
Downstream analytics pipelines join these attribution tokens with longitudinal session logs, enabling data teams to construct dedicated cohort retention matrices for each acquisition source without relying on blended approximations.
Evaluating Channel Quality Empirically
Acquisition source does not imply a universal retention ranking. Referral, search, display, affiliate, and organic cohorts can outperform one another depending on audience composition, creative alignment, product utility, geographic market, and onboarding paths.
The objective of channel segmentation is to measure these performance curves empirically rather than assuming a universal performance hierarchy across marketing channels.
Calculating Cost Per Retained User Accurately
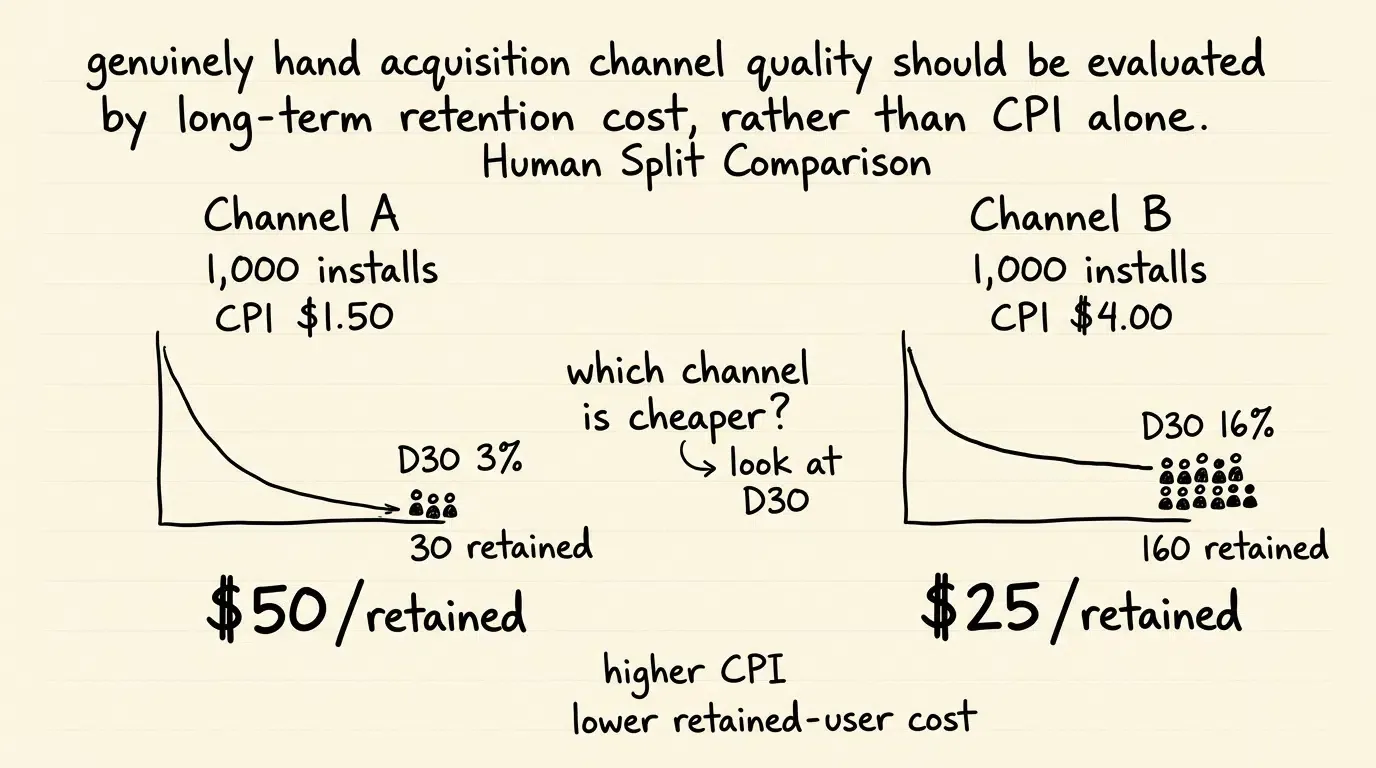
Evaluating acquisition channels solely through Cost Per Install (CPI) can obscure true capital efficiency. A channel with a low CPI may yield higher overall customer acquisition costs if its retention decay is severe.
The effective Cost Per Retained User at Day 30 (
Where
Consider an illustrative scenario comparing two acquisition channels evaluated over an identical 30-day window:
- Channel A (Lower CPI, Steeper Decay): Delivers 1,000 installs at a
( ). Day 30 retention is ( ). The cost per Day 30 retained user is . - Channel B (Higher CPI, Resilient Plateau): Delivers 1,000 installs at a
( ). Day 30 retention is ( ). The cost per Day 30 retained user is .
Measuring retention at the channel level demonstrates that Channel B is twice as cost-effective at acquiring Day-30 retained users despite having a significantly higher initial install cost.
Architecting an End to End Retention Telemetry and S2S Ingestion Pipeline
Structuring Client-Side Session Heartbeats and Lifecycle Event Loggers
Accurate retention measurement requires resilient client-side event tracking integrated with native operating system lifecycles:
- Android Telemetry: Hooks into
Application.ActivityLifecycleCallbacksto monitoronActivityResumedandonActivityPausedstates, tracking foreground transitions and computing active durations. - iOS Telemetry: Implements scene lifecycle callbacks through
UISceneDelegateorUIWindowSceneDelegate(such assceneDidBecomeActive(_:)andsceneDidEnterBackground(_:)) and, where appropriate, observes application-levelUIApplicationlifecycle notifications (such asUIApplication.didBecomeActiveNotification).
Telemetry SDKs store lifecycle events in local persistent queues, dispatching them opportunistically during active network connections and retrying failed transmissions with idempotent request tokens.
Background Execution and Telemetry Transmission Constraints
Operating systems enforce strict resource constraints on background execution. On Android, persistent background synchronization tasks are managed through Jetpack WorkManager, while iOS regulates background execution via the BackgroundTasks framework (BGTaskScheduler).
Because background task execution is scheduled dynamically by the operating system based on battery level, device usage patterns, and thermal constraints, analytics architectures must not rely on background execution for deterministic real-time event dispatching. Crucially, automated background execution tasks must be tagged explicitly in the telemetry schema and excluded from user-active retention metrics.
Transmitting Structured Telemetry Payloads to Real-Time Ingestion Brokers
Client-side telemetry pipelines emit structured JSON payloads containing pseudonymous instance identifiers, session sequence indexes, UTC timestamps, and contextual attribution metadata.
The active_input_duration_seconds field represents an optional, product-specific telemetry metric; applications centered on passive media consumption may substitute audio streaming duration, reading progress, or navigation events.
Developers can consult the retention analytics raw data documentation for technical specifications regarding data schema formatting and export integrations.
The payload below demonstrates a structured lifecycle telemetry event designed for downstream cohort retention processing:
{
  "event_id": "evt_5a4b3c2d-1e0f-9a8b-7c6d-5e4f3a2b1c0d",
  "event_name": "session_heartbeat_active",
  "timestamp_utc": "2026-08-28T02:45:00.120Z",
  "session_context": {
    "session_id": "sess_8f7e6d5c4b3a2109",
    "event_sequence_index": 14,
    "session_duration_seconds": 125,
    "active_input_duration_seconds": 112,
    "days_since_cohort_anchor": 7,
    "is_qualifying_active_event": true
  },
  "user_identity": {
    "app_instance_id": "inst_anon_a1b2c3d4-e5f6-7890-abcd-ef1234567890",
    "user_cohort_date": "2026-08-21"
  },
  "attribution_context": {
    "acquisition_channel": "referral_partner",
    "campaign_id": "cmp_q3_retention_drive",
    "channel_code": "partner_tier1_affiliate",
    "inviter_token_pseudonymous": "ref_tok_anon_44332211"
  },
  "device_telemetry": {
    "platform": "Android",
    "os_version": "16.0",
    "app_version": "3.1.0",
    "sdk_version": "1.0.0",
    "network_type": "WIFI"
  },
  "diagnostic_metadata": {
    "is_background_wake": false,
    "memory_pressure_state": "normal",
    "crash_count_in_session": 0
  }
}
The Retention Cohort Matrix Data Pipeline
Ingested telemetry events pass through stream-processing layers where they are de-duplicated, validated against attribution records, and aggregated into dimensional cohort retention matrices.
The pipeline architecture below outlines the end-to-end data flow:
[Client App Active Event] ──> [Telemetry Ingestion Gateway] ──> [Attribution Join Engine]
           │                              │                             │
           ▼                              ▼                             ▼
   Session Heartbeat              Structured Payload            Map channelCode & UTM
  (Timestamp & User ID)          (De-duplicated Event)          (Enrich with Cohort ID)
           │                              │                             │
           └──────────────────────────────┴─────────────────────────────┘
                                          │
                                          ▼
                         [Data Warehouse / Analytics Engine]
                                          │
                                          ▼
                        [N-Day Cohort Matrix ($D_1 \dots D_{90}$)]
In the data warehouse layer, automated transformation models execute daily aggregations to construct standard cohort matrices, mapping defined cohort anchors against sequential active milestones (
When Is Custom Retention Analytics Tooling Necessary for Growth Teams
Suitable Conditions for Dedicated Retention Measurement Infrastructure
Deploying dedicated in-app retention analytics and raw event streaming pipelines provides operational value under specific conditions:
- Multi-Channel Acquisition Operations: Organizations managing diverse paid media, influencer, affiliate, and referral channels requiring cross-channel LTV and retention de-duplication.
- Subscription and SaaS Business Models: Products where unit economics depend on sustained multi-month or annual retention rather than single transactional purchases.
- High-Volume Event Ecosystems: Applications in mobile gaming, social networking, and fintech where feature-level behavioral analysis is needed to identify retention-driving functional paths.
- Custom Machine Learning Pipelines: Data engineering teams training predictive churn models that require unaggregated, low-latency event logs for automated re-engagement workflows.
Unsuitable Conditions for Complex Retention Deployments
Deploying custom retention measurement infrastructure may introduce unnecessary operational complexity in the following scenarios:
- Single-Session Utility Applications: Basic single-purpose tools (such as file converters or offline calculators) where repeat engagement is neither expected nor central to the monetization model.
- Early Prototype Explorations: Pre-product-market-fit applications focused solely on validating core technical feasibility before establishing product-market validation.
- Single-Channel Organic Products: Applications relying solely on unassisted organic app store search with no external paid acquisition, deep linking, or referral mechanics.
Common Misconceptions in Retention Analytics Strategy
- Misconception: Day 1 Retention Predicts Long-Term Cohort Survival Universally: While strong Day 1 retention indicates effective onboarding UX, it does not guarantee high Day 30 retention. Products with high novelty value often experience sharp decay between Day 7 and Day 30 if long-term utility is absent.
- Misconception: All Session Launches Represent Valid Active Users: Treating every app launch as an active session pollutes analytics data with automated background tasks, brief accidental opens, and superficial launches, artificially inflating retention calculations.
Frequently Asked Questions (FAQ)
Can mobile app analytics detect when a user uninstalls the app?
What is the mathematical difference between N Day retention and unbounded retention?
How do acquisition channel parameters impact long term cohort retention curves?
Summary and Decision Framework
Optimizing user retention requires moving beyond aggregated app store metrics toward granular, cohort-segmented behavioral telemetry. Understanding retention decay relies on formally defining active user thresholds, applying appropriate measurement models (N-Day, Unbounded, or Bracketed), and connecting post-install engagement with pre-install acquisition context.
Establishing a durable retention measurement architecture requires logging structured lifecycle events and joining client-side telemetry with independent attribution metadata. By implementing structured event pipelines, engineering and product teams can diagnose churn drivers early, allocate marketing budgets toward durable acquisition channels, and drive sustainable growth.
To evaluate how unified attribution and event telemetry infrastructure can support your application’s retention measurement, explore the mobile attribution implementation reference.
Related Materials
-
Concepts: Cohort Analysis, N-Day Retention, Unbounded Retention, Churn Decay Modeling, Session Telemetry
-
Technologies: Mobile App Analytics, Event Stream Ingestion, Server-to-Server Webhooks, Raw Data Pipelines
-
Standards: IETF RFC 9110 HTTP Semantics, OWASP Mobile Application Security Testing Guide (MASTG)
-
APIs: Android Jetpack
WorkManager, Apple Background Tasks framework (BGTaskScheduler), OpoInstall SDK Event Logging API -
Official Documentation & References:
Share this article