What is a good retention rate for mobile games? In large cross-platform datasets, overall mobile-game median retention sits around 20% to 24% for Day 1 and below 5% for Day 7, while directional upper-performance benchmarks can reach the high-30% range for Day 1 and 8% to 14% on Day 7, depending on market, genre, monetization model, and cohort definition.
Game retention rate measures the percentage of an acquired player cohort that returns to play a mobile game at specific elapsed intervals following installation. In game analytics and publishing evaluation, Day 1 and Day 7 retention rates serve as important soft-launch indicators evaluated alongside monetization, technical stability, and acquisition economics to help assess whether observed player return behavior is strong enough to justify further scaling tests.
| Term | Definition | Related Entity | Search Intent Role |
|---|---|---|---|
| Retention Rate | The mathematical percentage of a player cohort active on a specific elapsed day. | User Retention | Informational / Commercial |
| User Retention | The ongoing engagement and return behavior of players over time. | Cohort Analysis | Informational |
| Core Gameplay Loop | The recurring cycle of primary player actions, rewards, and progression. | App Analytics | Technical / Informational |
How Mobile Game Retention Informs Soft-Launch and Monetization Decisions
The Soft-Launch Gate: Why Studios Evaluate Early Retention Alongside Acquisition Economics
During technical soft-launches and regional beta testing, mobile game studios evaluate retention metrics as a leading indicator of product viability. While top-of-funnel acquisition metrics (such as Cost Per Install or store conversion rates) can be influenced by ad creative iteration and App Store Optimization, retention rate captures observed return behavior influenced by gameplay design, technical stability, player acquisition mix, and lifecycle context.
Scaling user acquisition on a title with steep retention decay creates an unsustainable economic model where acquisition spend outpaces cumulative monetization. A multiplayer or liveops-driven game that experiences rapid cohort attrition struggles to build the active player liquidity required for matchmaking pools, guild economies, and social features. Studios evaluate early retention curves alongside monetization depth, player conversion, and technical performance when making soft-launch scaling decisions.
The Mathematical Link Between Retention Curves and Player Lifetime Value
Player Lifetime Value (LTV) can be approximated as the cumulative sum of daily expected cohort revenue contributions over time. In mobile gaming analytics, LTV across an observation horizon
Where
Daily Revenue / Player ($)
  ▲
  │     ┌─────────────────────────────────────────────────────────────┐
  │     │ Cumulative Lifetime Value (LTV)                               │
  │     │ Area = ∑ [ R(t) × ARPDAU(t) ]                               │
  │     └─────────────────────────────────────────────────────────────┘
  │
  ├──────┐
  │            │▀▄
  │            │    ▀▄  Daily Revenue Contribution: R(t) × ARPDAU(t)
  │            │        ▀▄▄▄
  │            │                ▀▀▀▄▄▄▄▄▄▄▄▄▄▄▄▄▄▄▄▄▄▄▄▄▄▄▄▄▄▄▄▄▄▄ (Long-Tail Contribution)
  └──────┴──────┬──────────┬──────────┬──────────┬──────────┬─────────► Time (t)
                D0        D1                     D7                   D14                   D30                   D90
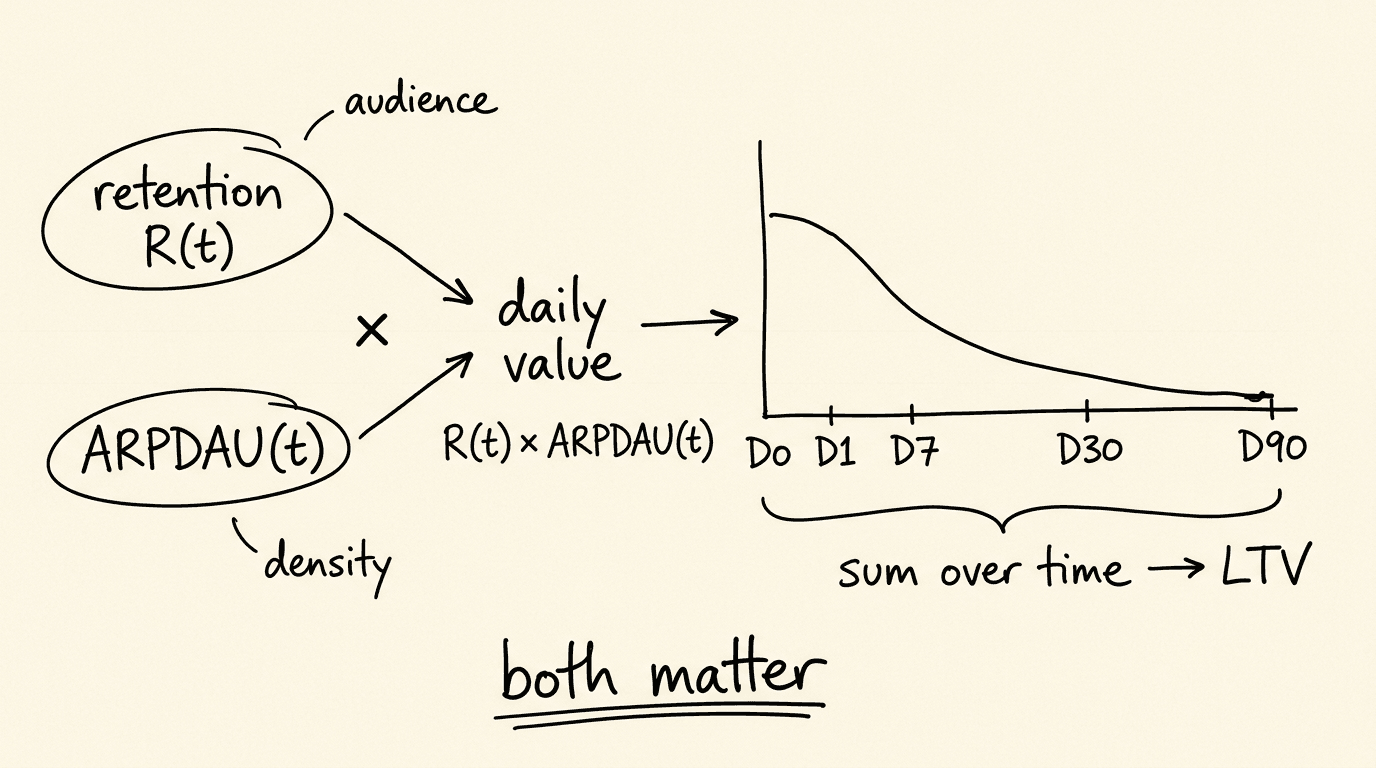
Retention contributes to LTV by determining how many cohort members remain active and eligible to generate revenue at each interval; realized LTV also depends on monetization density among active players. A higher Day 7 retention value increases cumulative revenue contribution at Day 7; whether that improvement persists into subsequent milestones (
Distinguishing First-Time User Experience Drop-Off from Core Loop Attrition
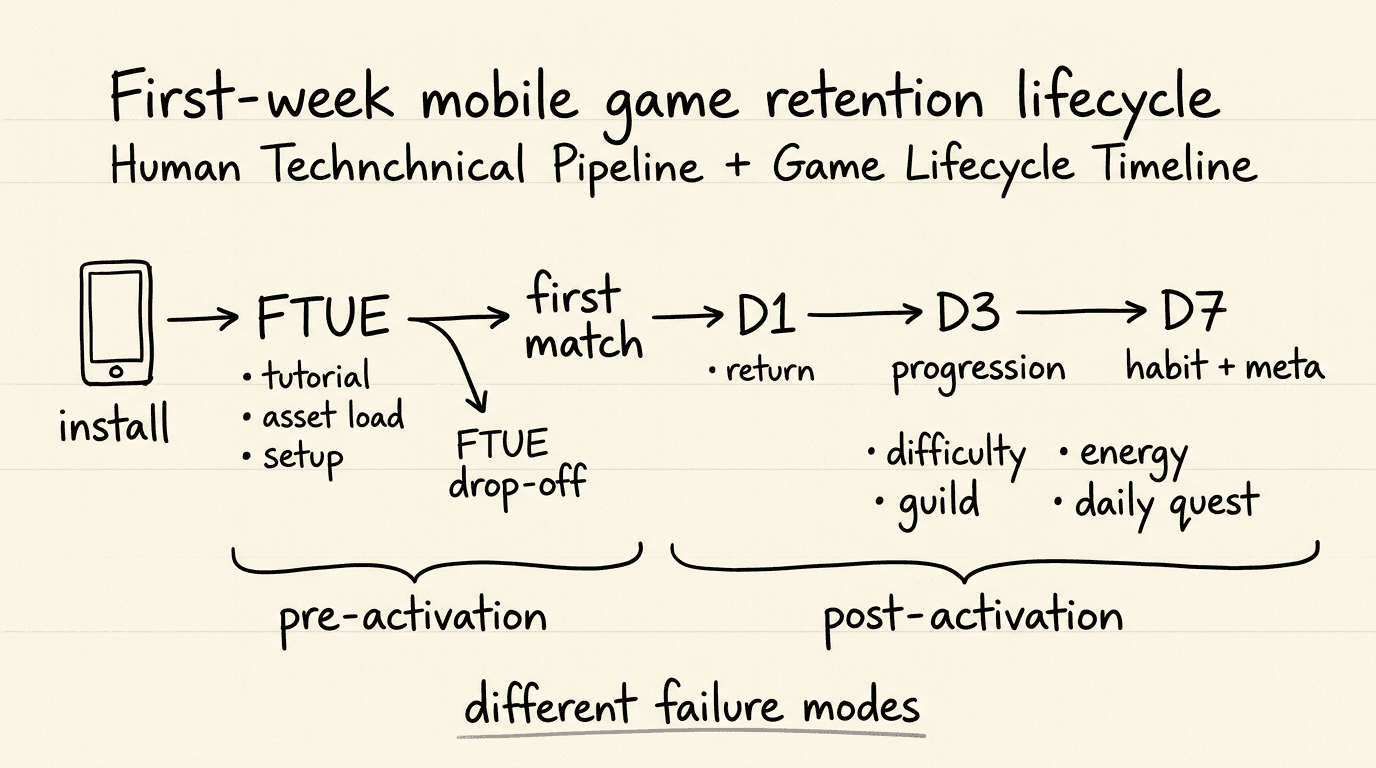
Auditing mobile game retention requires separating First-Time User Experience (FTUE) drop-off from post-activation core loop attrition:
- FTUE Drop-Off (Pre-Activation): Measures sequential abandonment occurring within the initial setup, asset downloading, account registration, or interactive tutorial stages (
). High FTUE drop-off may be associated with technical friction, long secondary asset downloads, or confusing tutorial steps. - Core Loop Attrition (Post-Activation): Measures the rate at which players who completed the initial tutorial fail to return in subsequent days (
). Core loop attrition may flag candidate issues such as progression pacing friction, unrewarding gameplay loops, or difficulty spikes.
Isolating FTUE drop-offs from subsequent lifecycle milestones enables development teams to differentiate technical onboarding friction from gameplay progression challenges.
Developers seeking lightweight client telemetry and attribution SDKs can explore packages via the mobile analytics SDK package.
What Constitutes a Good Retention Rate Across Mobile Game Genres
Hyper-Casual Titles: High Upfront Day 1 Return with Rapid Early Decay
Hyper-casual games rely on simple, instant-play mechanics designed for broad audiences. Monetization is heavily weighted toward In-App Advertising (IAA), including rewarded video, interstitial ads, and banner placements.
- Performance Distribution: Cross-platform industry datasets indicate that median hyper-casual Day 1 retention sits around 20%–24%, while directional upper-performance bands can reach 34%–42%. Day 7 retention medians typically decline to 3%–5%, with stronger-performing titles reaching 8%–12%.
- Analytical Focus: Because hyper-casual monetization relies on rapid ad exposure, teams commonly prioritize initial Day 1 return rates and session frequency to generate sufficient ad impression volume before player attrition occurs.
Casual and Puzzle Games: Balanced Day 1 and Day 7 Curves Sustained by Level Pacing
Casual titles (such as match-3, puzzle, and time-management games) utilize hybrid monetization models combining rewarded ads with In-App Purchases (IAP) for extra moves, lives, or boosters.
- Performance Distribution: Benchmark reports place median Day 1 retention for casual puzzle titles between 20% and 25%, with directional upper-performance bands reaching 32%–38%. Day 7 retention medians range between 4% and 8%, with stronger-performing titles reaching 10%–15%.
- Analytical Focus: In casual categories, retention analysis frequently focuses on level progression curves, streak mechanics, and difficulty pacing to minimize friction while encouraging daily session habits.
Mid-Core and Action RPGs: Lower Day 1 Baselines with Resilient Long-Term Stabilization
Mid-Core games (including gacha RPGs, battlers, and strategy titles) feature complex meta-economies, character progression systems, and guild mechanics. Monetization is driven primarily by IAP microtransactions.
- Performance Distribution: Mid-Core titles often record lower Day 1 medians (15%–20%, with upper-performance reference bands reaching 26%–32%). Lower early retention may coincide with deeper setup flows, larger initial asset downloads, or more complex onboarding, which should be validated within the title’s own telemetry. Day 7 retention in upper-tier bands often sustains 7%–12%.
- Analytical Focus: Analytical focus in mid-core gaming often centers on the depth of the meta-game, inventory management systems, and cooperative multiplayer loops that support long-term player investment.
4X Strategy and Hardcore Titles: Highly Selective Onboarding and Longer-Tail Retention
4X strategy and hardcore MMO titles feature steep learning curves and alliance-based gameplay. These titles experience significant early drop-off during onboarding but achieve high retention among activated cohorts.
- Performance Distribution: Strategy titles record Day 1 medians around 18%–22% (upper-performance reference bands reaching 28%–34%), with Day 7 medians between 3% and 6% (upper-performance bands reaching 8%–13%), potentially demonstrating slower later-stage decay among retained cohorts.
- Analytical Focus: Hardcore retention metrics can be evaluated alongside alliance participation, territory warfare, and social accountability, which often correlate with multi-month retention among engaged player cohorts.
Deconstructing the Classic Forty Twenty Ten Rule in Modern Game Economics
The 40-20-10 Heuristic as a Historical Directional Baseline
The “40-20-10 rule” (40% Day 1 retention, 20% Day 7 retention, and 10% Day 30 retention) is widely referenced as an informal industry shorthand. It provides a memorable reference scale for evaluating top-tier casual retention, but it does not represent an empirical universal standard across modern mobile gaming categories.
Why Universal Rules of Thumb Fail Across Hybrid Monetization Frameworks
Applying the 40-20-10 heuristic uniformly across all mobile games leads to inaccurate publishing decisions. Contemporary mobile games employ diverse monetization models—ranging from pure programmatic advertising to deep gacha economies and battle pass subscriptions—each operating on distinct retention dynamics.
For instance, an ad-monetized hyper-casual title with strong Day 1 retention may struggle to achieve profitability if ad impression density is insufficient relative to acquisition costs. Conversely, a mid-core 4X strategy game with a 22% Day 1 retention rate can achieve strong financial returns if its Day 30 retention stabilizes and average revenue per paying user is high. Universal heuristics fail because they evaluate retention in isolation from monetization depth and player lifetime value.
Adjusting Retention Targets Based on Acquisition Cost and Unit Economics
Retention benchmarks must be evaluated alongside Customer Acquisition Cost (CAC) and Cost Per Install (CPI). A studio acquiring users at low unit costs through organic channels or referral programs can sustain viability with lower retention metrics than a studio acquiring users at higher costs in competitive programmatic auctions.
When evaluated on an install-cohort basis (where
If evaluated on an activated-player basis (where
Evaluating retention targets in equilibrium with acquisition unit economics ensures that studios optimize for sustainable net returns rather than arbitrary vanity targets.
How to Diagnose First Week Gameplay Drop Offs from Tutorial to Day Seven
Instrumenting Step-by-Step FTUE Telemetry: Locating Tutorial and Level Bottlenecks
To diagnose why new players abandon a game, analytics pipelines instrument FTUE tutorials as sequential state machines. Each tutorial step, cutscene transition, and level completion emits a structured telemetry event containing the step index, duration, and error status.
Analyzing step-to-step drop-off flags candidate friction points for further testing:
- Narrative Latency: Unskippable dialogue sequences that delay core interactive mechanics.
- Unclear Guidance: Ambiguous UI prompts that leave players uncertain of the required action.
- Asset Loading Delays: In-game asset downloads that interrupt initial gameplay flow.
Analyzing Day 1 to Day 3 Session Velocity: Identifying Gating Friction and Difficulty Spikes
The transition from Day 1 to Day 3 reveals how players interact with the game’s core progression systems once guided tutorials conclude. During this window, players encounter initial progression gates, energy timers, and resource constraints.
Data teams track session velocity—measuring daily session counts, mean session duration, and level completion rates—to identify potential gating imbalances:
- Localized Progression Drops: A sharp decline in level completion rates can flag candidate difficulty spikes that warrant investigation and controlled tuning tests.
- Resource Constraints: Overly restrictive energy timers that force new players to exit before establishing an engagement habit with the core loop.
The Day 7 Milestone: Evaluating Progression Depth, Meta-Systems, and Guild Integration
By Day 7, initial novelty has subsided. Day 7 retention can be analyzed alongside the adoption of secondary meta-systems, such as gear crafting, PvP arenas, daily quests, and guild participation.
Telemetry pipelines evaluate Day 7 health by tracking:
- Meta-Feature Adoption: The proportion of active Day 7 players who have unlocked and actively use secondary progression systems.
- Guild and Social Affiliation: The retention divergence between solo players and players who joined an alliance or active co-op group within their first week.
Structuring Game Lifecycle Telemetry Payloads for Cohort Analysis
Every emitted session event should include contextual telemetry properties that link in-game progression milestones to acquisition source parameters. The session_duration_seconds value is derived directly from monotonic timing (session_elapsed_monotonic_ms) to prevent wall-clock jump distortions.
The diagram below outlines the data flow from initial download to segmented Day 7 retention analysis:
[Store Install & Launch] ──> [FTUE Tutorial Step 1..N] ──> [First Core Match Complete]
             │                            │                             │
             ▼                            ▼                             ▼
     Event: app_launch           Event: tutorial_step          Event: core_loop_complete
    (Install Anchor: D0)         (Drop-Off Diagnostic)         (Player Activation State)
             │                            │                             │
             └────────────────────────────┴─────────────────────────────┘
                                          │
                                          ▼
                         [Day 1 to Day 7 Return Telemetry]
                                          │
                                          ▼
                       [Segmented Retention Curve by Channel]
The JSON payload below demonstrates an illustrative production-oriented game session telemetry event linking gameplay progression to acquisition channel parameters:
```json
{
  "schema_version": "1.2.0",
  "event_id": "evt_game_8f7e6d5c-4b3a-2109-8765-4a3b2c1d0e9f",
  "event_name": "game_session_active",
  "client_event_timestamp_utc": "2026-08-29T10:15:30.250Z",
  "session_elapsed_monotonic_ms": 340120,
  "server_received_timestamp_utc": "2026-08-29T10:15:31.050Z",
  "player_identity": {
    "app_instance_id": "inst_anon_g9h8i7j6-5k4l-3210-9876-fedcba654321",
    "player_level": 14,
    "current_chapter": 3
  },
  "gameplay_telemetry": {
    "session_id": "sess_game_1234567890abcdef",
    "event_sequence_index": 22,
    "session_duration_seconds": 340,
    "ftue_tutorial_completed": true,
    "matches_played_in_session": 3,
    "guild_membership_active": true,
    "guild_id_pseudonymous": "guild_tok_anon_dragon_88"
  },
  "attribution_context": {
    "acquisition_channel": "social_invite",
    "campaign_id": "cmp_guild_referral_q3",
    "channel_code": "unity_ads_tier1",
    "inviter_token_pseudonymous": "ref_tok_anon_hero_55"
  },
  "device_telemetry": {
    "platform": "Android",
    "os_version": "16.0",
    "app_version": "2.1.0",
    "sdk_version": "<installed_sdk_version>",
    "network_type": "WIFI",
    "device_tier": "high_end"
  },
  "diagnostic_metadata": {
    "is_background_wake": false,
    "frame_rate_average": 59.4,
    "memory_pressure_state": "normal"
  }
}
Comparative Evaluation of Gaming Retention Benchmarks by Genre and Monetization
Contextual Peer Benchmark Matrix: Evaluating Medians and Upper Quartiles Across Verticals
Evaluating game performance requires comparing retention metrics against peer titles operating within the same vertical, monetization model, and target percentile band. Platform analytics tools (such as Apple App Store Connect Peer Benchmarks and Google Play Console Peer Groups) provide dynamic percentiles (25th, 50th, 75th) categorized by app genre and business model, reinforcing that benchmarks must serve as contextual comparisons rather than fixed universal numbers.
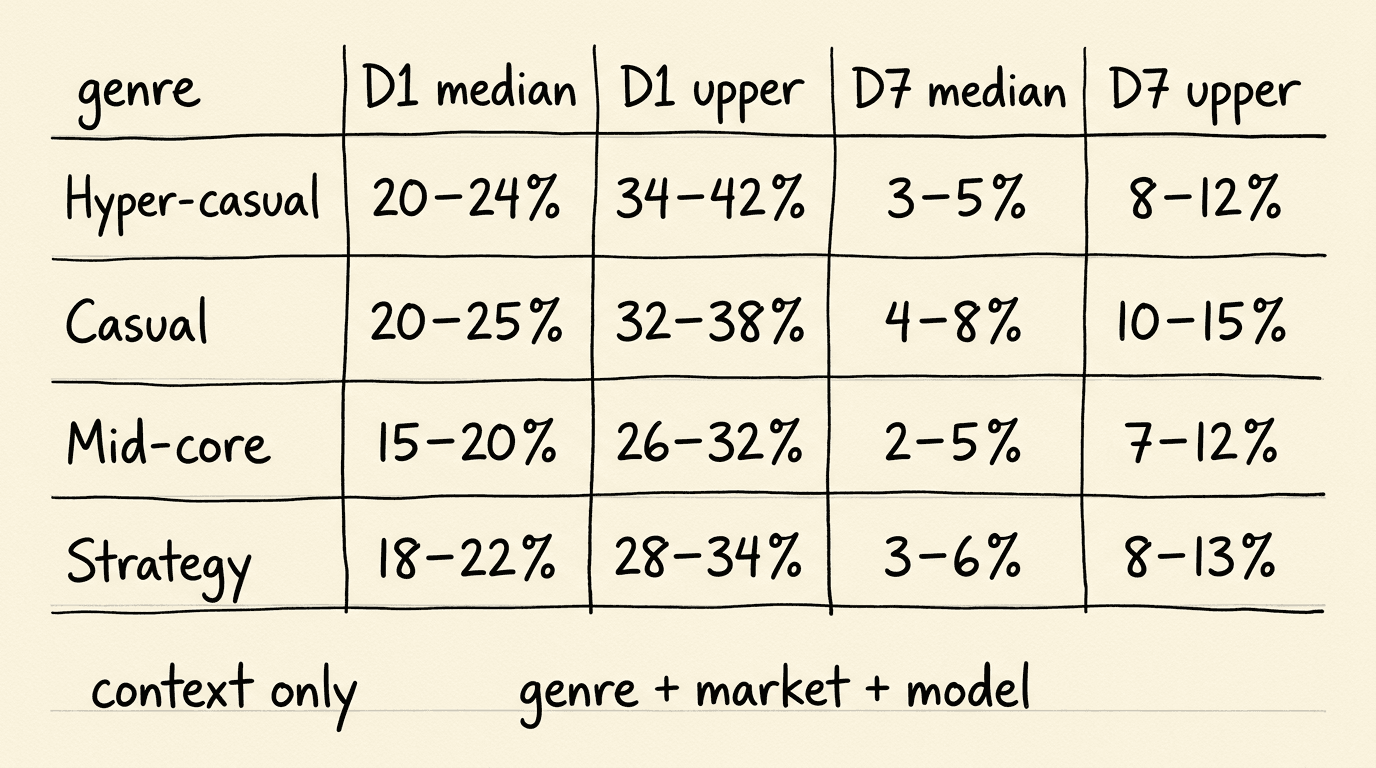
The matrix below outlines representative benchmark ranges across major mobile gaming genres:
| Mobile Game Vertical | Primary Monetization Model | Median Range ( |
Directional Upper-Performance Band ( |
Median Range ( |
Directional Upper-Performance Band ( |
Key Analytical Focus |
|---|---|---|---|---|---|---|
| Hyper-Casual | In-App Advertising (IAA) | 20% – 24% | 34% – 42% | 3% – 5% | 8% – 12% | Immediate session frequency and ad impression velocity |
| Casual / Puzzle | Hybrid (IAA + Casual IAP) | 20% – 25% | 32% – 38% | 4% – 8% | 10% – 15% | Level progression curves and streak mechanics |
| Role Playing / Mid-Core | In-App Purchases (IAP) | 15% – 20% | 26% – 32% | 2% – 5% | 7% – 12% | Meta-economy depth, gacha loops, and character building |
| Strategy / 4X | Heavy In-App Purchases | 18% – 22% | 28% – 34% | 3% – 6% | 8% – 13% | Alliance formation, guild warfare, and social anchoring |
*Note: Methodology and Provenance: Median ranges are derived from published genre-level benchmarks across multi-year cross-platform reports (such as GameAnalytics industry datasets). The upper-performance bands represent an editorial directional synthesis informed by global and regional top-decile (90th percentile) distributions and genre-specific reports (including Adjust puzzle and match-3 studies). They do not represent a single published dataset’s exact genre-specific P90 values. Specific retention performance varies by operating system, geographic market, UA campaign mix, and active-session definition.
Evaluating the Interplay Between Ad-Driven and In-App Purchase Monetization Models
The choice of monetization model fundamentally shapes retention curve dynamics. Heavy in-app advertising can generate immediate monetization on Day 0 and Day 1 but introduces friction that may be associated with higher drop-off when frequency or placement disrupts gameplay.
Conversely, IAP-driven models prioritize long-term player immersion and progression balance over immediate monetization. In hybrid titles, game designers must carefully balance rewarded video placements—ensuring ads provide meaningful progression assistance without undermining the perceived value of IAP currency packages.
How Does Frictionless Match and Guild Routing Support Early Player Retention
Social Cohort Retention: Observed Engagement Across Connected Players
Telemetry across multiplayer and social titles shows an observed association between early social connectivity and flatter retention decay curves. Players who join active alliances, assist guild members, or participate in cooperative sessions often show stronger return patterns than unassociated solo players, providing an operational area for retention experimentation.
The Referral Barrier: Overcoming Manual Room Codes and Guild ID Friction
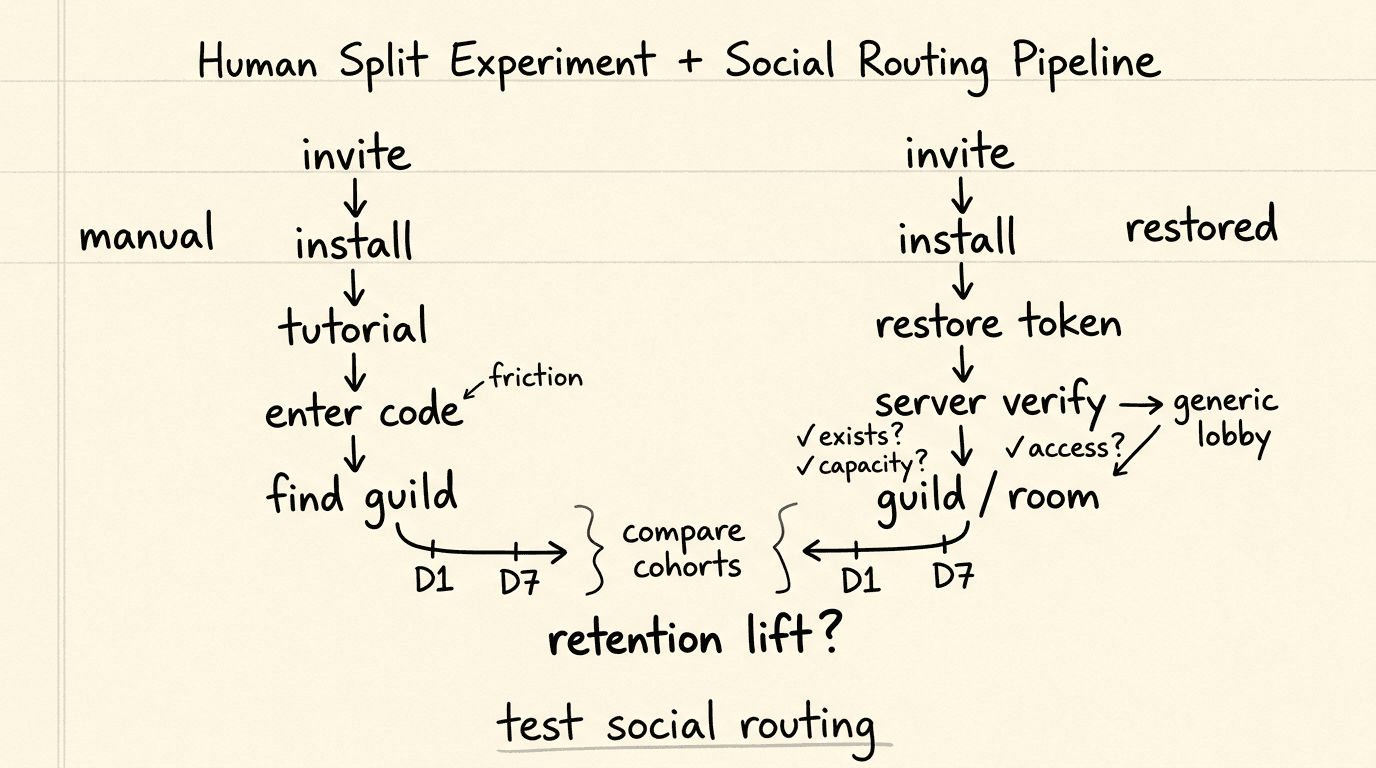
In traditional mobile multiplayer onboarding, inviting a friend requires cumbersome manual steps. Existing players must generate an alphanumeric invite code or room number, send it via external messaging apps, and instruct the recipient to download the game, complete the tutorial, and manually search for the specific lobby or guild ID.
This manual reconstruction requirement can introduce procedural friction and may contribute to onboarding drop-off before players experience cooperative gameplay.
Dynamic Scene Restoration: Parameterized Match and Guild Routing via OpoInstall SDK
Parameterized onboarding and deferred deep linking reduce manual referral friction by preserving social context across the installation flow.
OpoInstall, a mobile attribution and deep linking platform, implements dynamic parameter passing by capturing custom game context (such as ?room_id=9876&guild_id=dragon_guild&inviter=usr_102) on web sharing landing pages. When a new player downloads and launches the game for the first time, the native SDK restores this payload.
Engineers can consult the game parameter passing documentation for technical specifications on retrieving custom routing dictionaries during client initialization.
Upon retrieving custom parameters during initial launch, the game client passes the restored room or guild token to the backend server to verify room existence, player capacity, and access authorization before routing the player into the private match or guild. Removing manual input barriers bridges social intent, enabling development teams to evaluate whether frictionless Day 0 co-play improves Day 1 and Day 7 active player retention compared to unassisted control cohorts.
De-Polluting Soft-Launch Cohorts: Combining Channel Tagging with Anomaly Detection
During soft launches, teams should segment retention by acquisition source and inspect anomalous cohorts using independent traffic-quality signals.
OpoInstall supports Android channel package creation and unique channel tagging, enabling development teams to segment distribution sources without maintaining multiple build variants. When combined with anomaly monitoring (such as detecting unnatural click-to-install latency clusters or geographic concentration), data teams can flag anomalous sources for investigation and, after validation against independent quality or fraud signals, exclude confirmed invalid traffic to analyze clean, de-polluted retention cohorts.
Frequently Asked Questions (FAQ)
What is considered a good Day 1 retention rate for a hyper-casual mobile game?
How does in-game social connectivity impact Day 7 player retention?
How do deferred deep links facilitate seamless game room joining?
Summary and Decision Framework
Optimizing mobile game retention rates requires evaluating performance against genre-specific benchmarks rather than rigid universal heuristics. Achieving sustainable liveops viability relies on diagnosing tutorial friction, balancing level pacing across the first week, and evaluating how monetization mechanics interact with player return behavior.
Stabilizing early retention curves depends on combining granular in-game telemetry with friction-free social mechanics. By deploying lightweight SDK integration and contextual parameter restoration, platforms like OpoInstall provide the infrastructure required to measure retention across acquisition channels accurately and connect new players directly with active multiplayer communities.
To evaluate how unified attribution and parameter-passing infrastructure can support your mobile game retention, explore the mobile attribution implementation reference or register on the OpoInstall developer console.
Related Materials
-
Concepts: Mobile Game Retention Rate, FTUE Optimization, Core Gameplay Loop, Cohort Analysis, Social Retention
-
Technologies: Mobile Game Telemetry, Deferred Deep Linking, Android Channel Packages, S2S Webhooks
-
APIs & Data Interfaces: OpoInstall SDK
getInstallParamAPI, Custom Parameter Passing Interfaces, Channel Package Attribution Interfaces -
Official Documentation & References:
Share this article